See what Claude Code actually did.

The observability console for Claude Code — local-first, permanent, and honest about cost.

Claude Code writes a detailed transcript of every session — every turn, every token, every tool call, every sub-agent it spawned — and then tells you almost nothing about it. Argus tails those files into a SQLite archive on your machine, prices each turn, and serves a dashboard that answers the questions the transcripts never do: what am I spending, where did it go, and which turn made it so?

$ pip install argus-code$ argus start
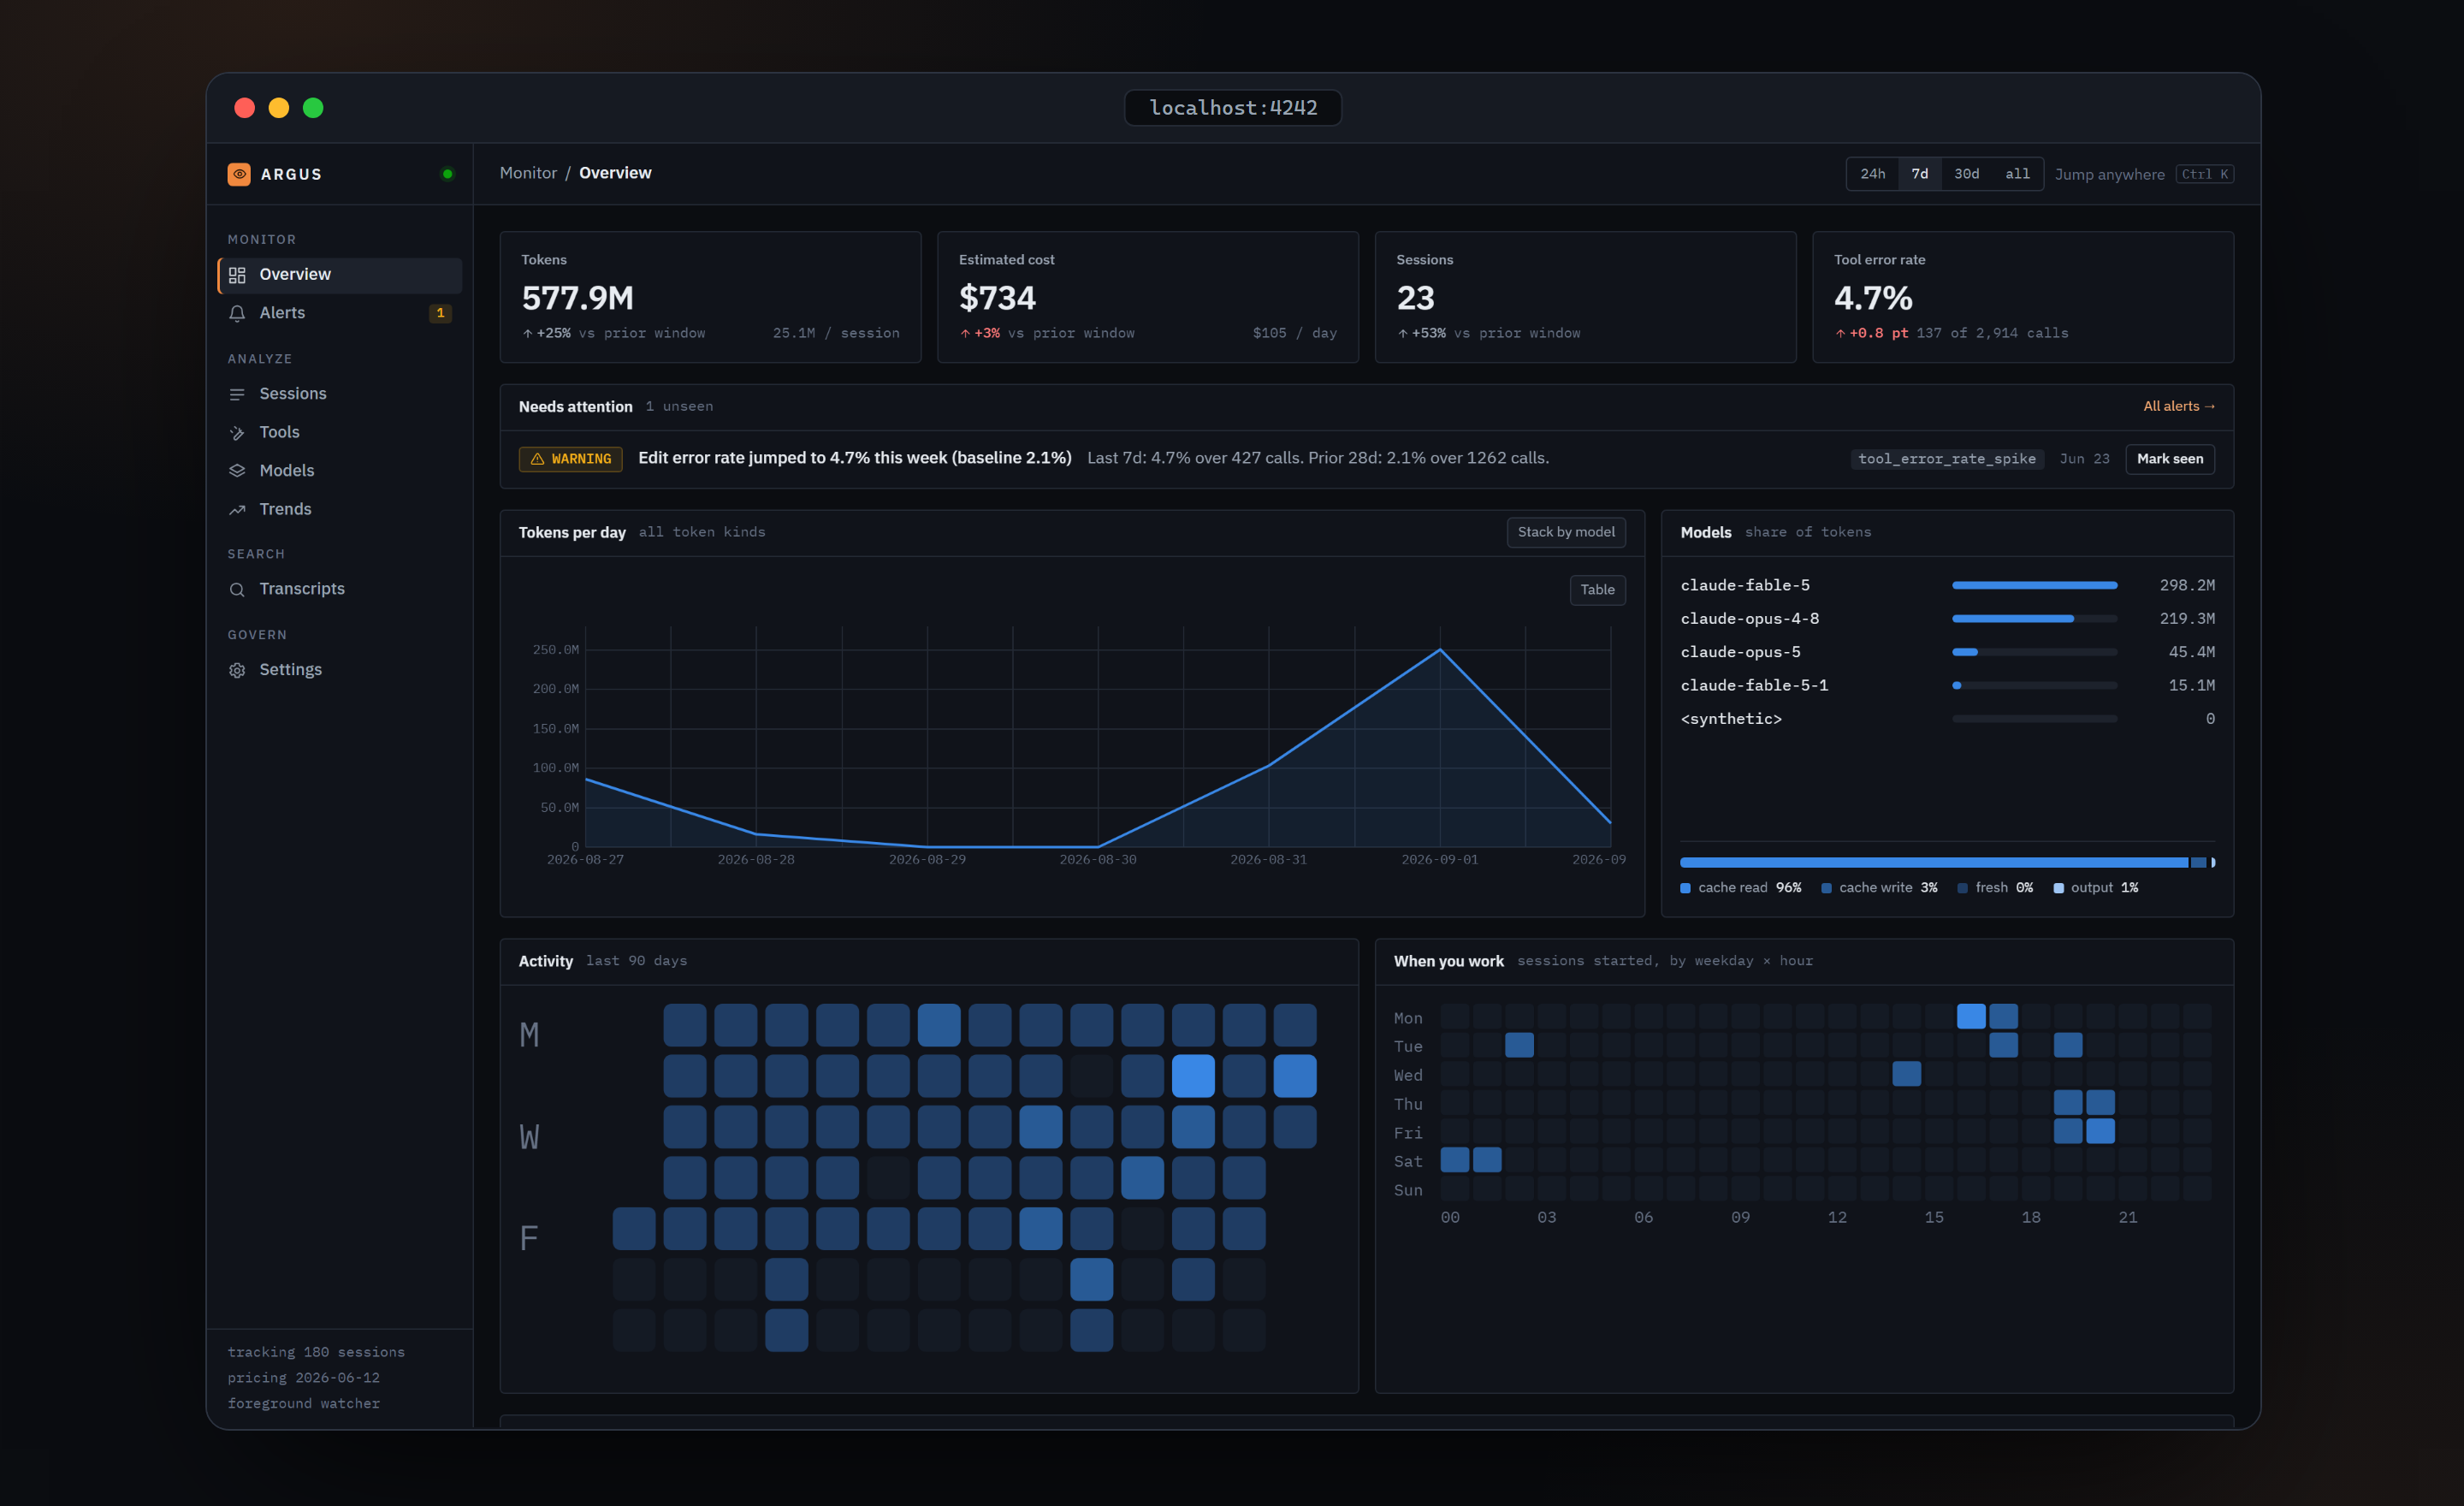
The Argus overview — tokens, cost, sessions and tool error rate at a glance

Why Argus

It does forensics, not just totals.

Argus keeps the structure of every session — turns, tool calls, sub-agents, cache reads — not just its sums. So you can find the turn that blew the budget, the tool that quietly started failing last Tuesday, and exactly what a sub-agent was told before it went off the rails.
It watches for you.

Detectors re-check your data every 10 minutes against historical baselines and file alerts — a tool whose error rate doubles gets flagged the day it breaks, not when you happen to notice.

It accumulates.

Claude Code rotates its own logs, so tools that read what is on disk see a sliding month. Once Argus has ingested a session the row stays forever; a few months in, Argus remembers sessions Claude has already forgotten.

A tour

Every session, priced

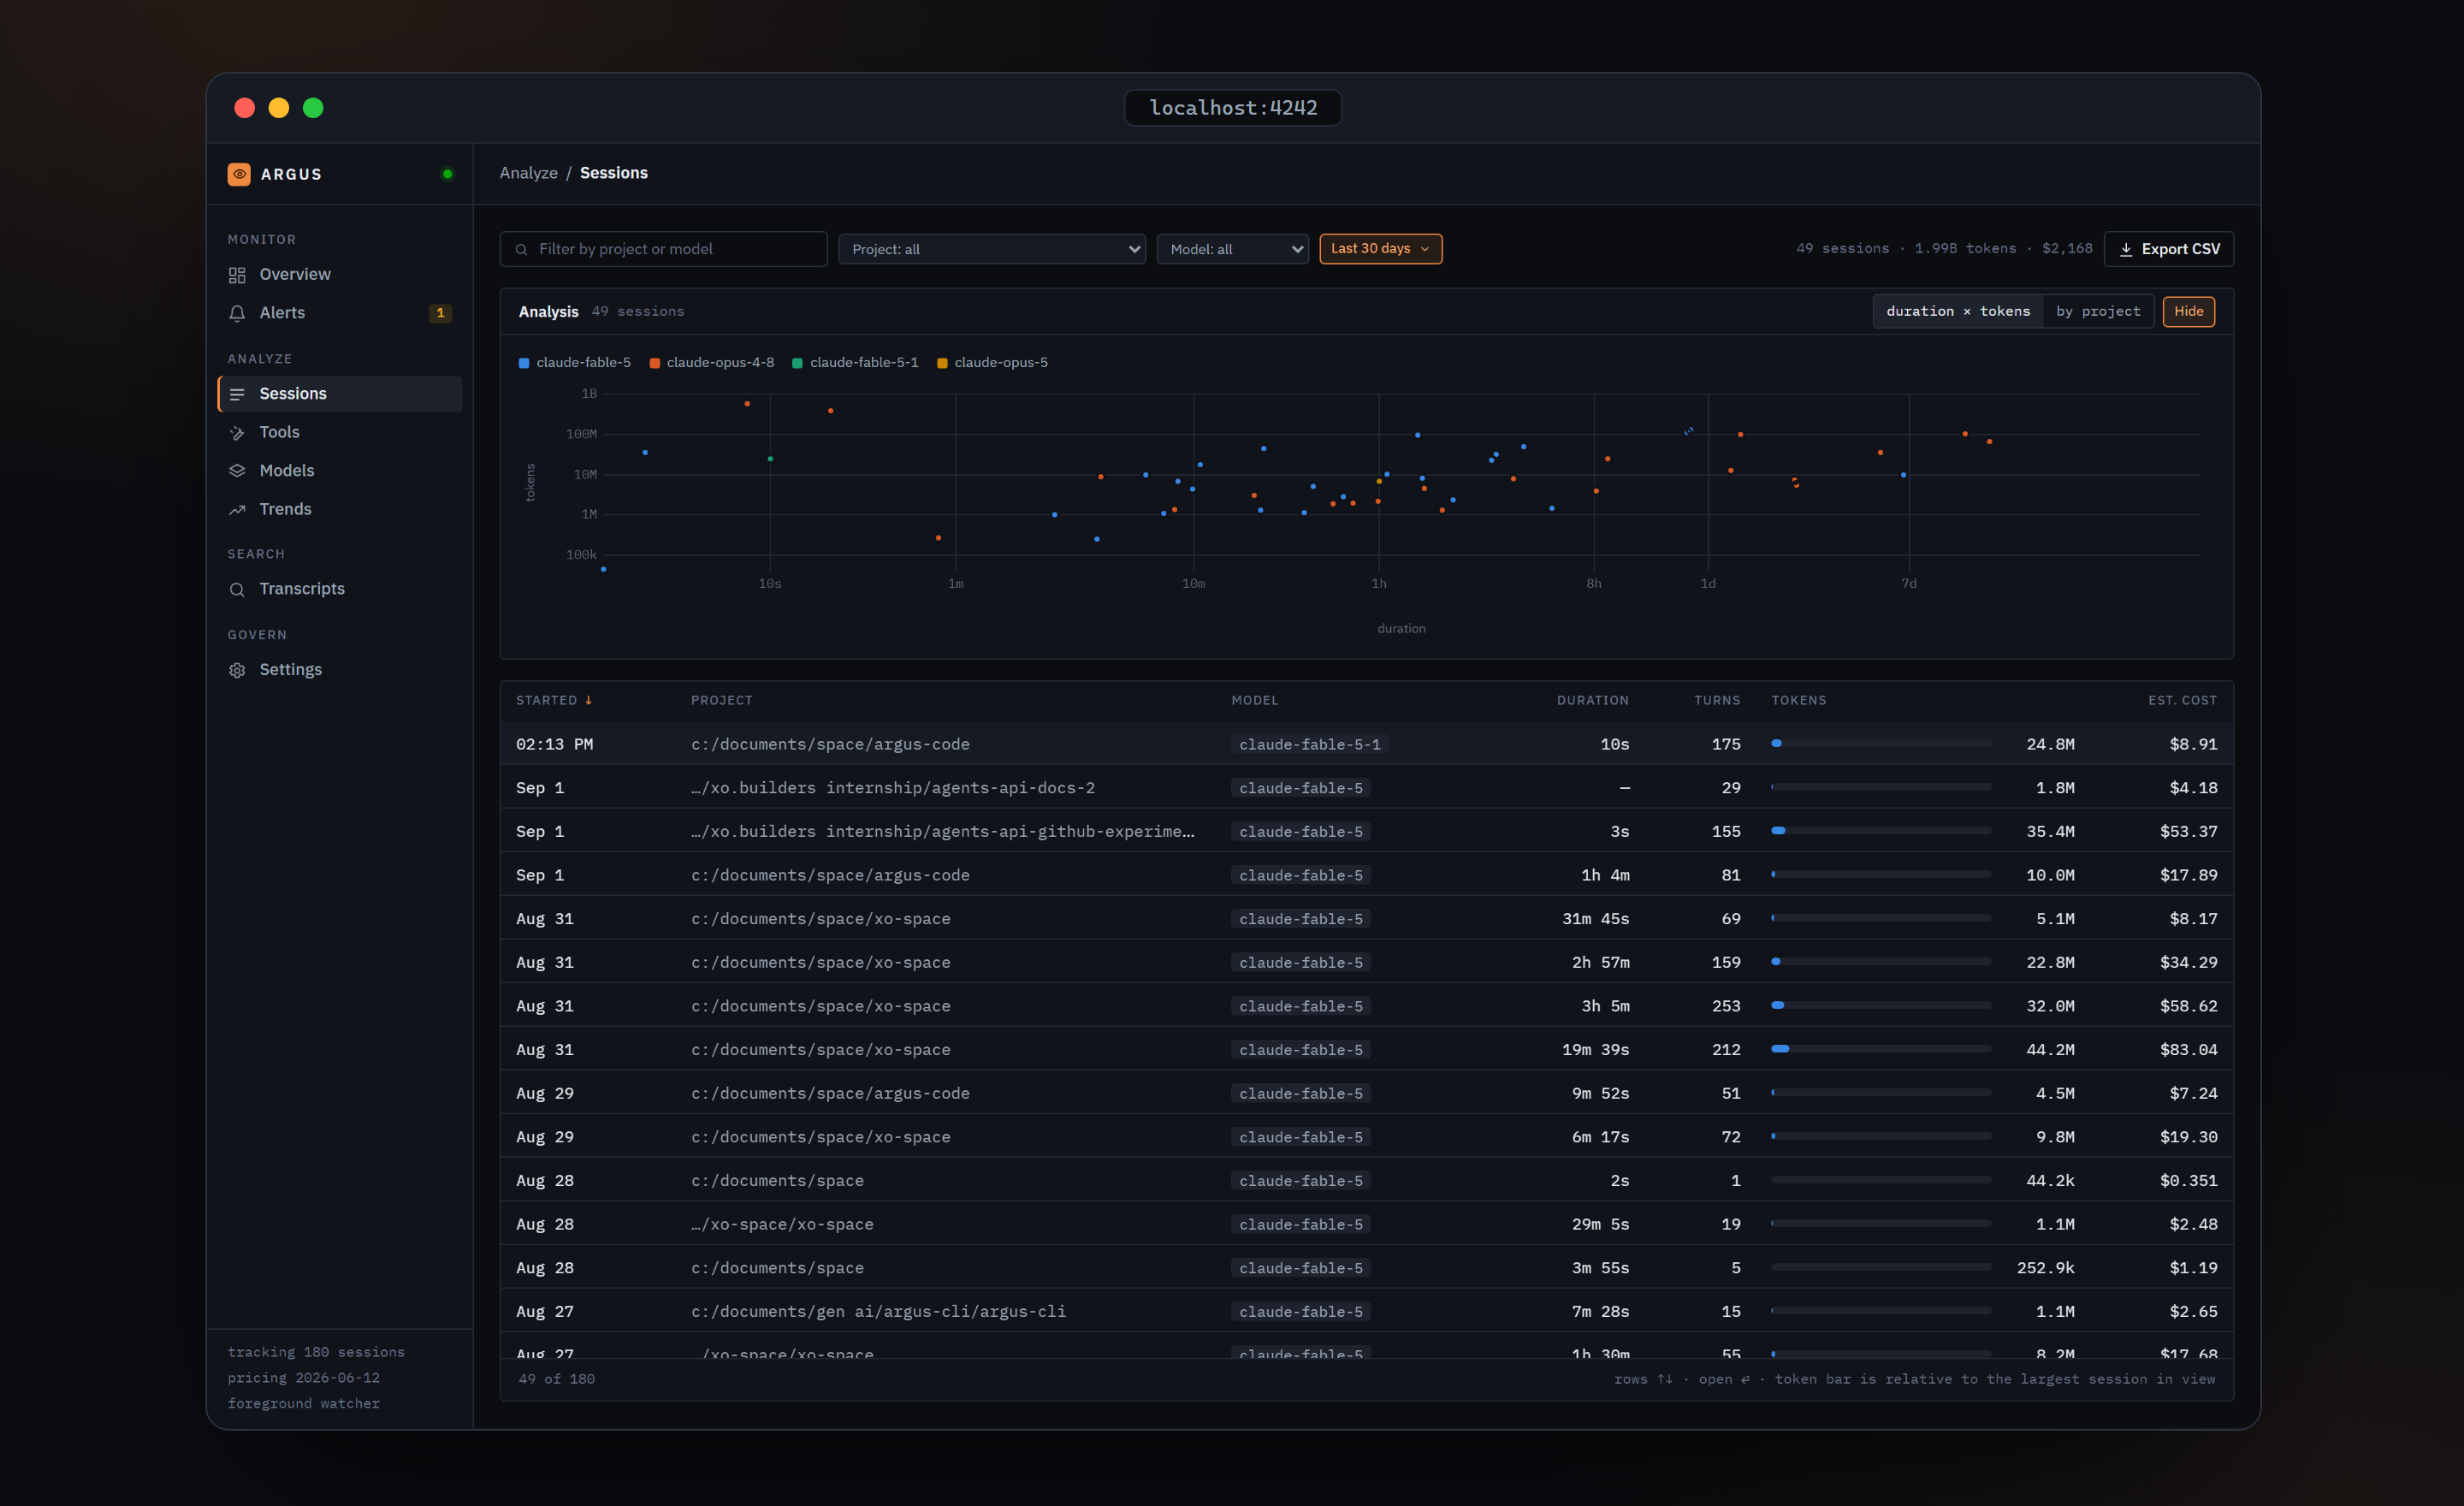
A virtualised, sortable grid of every session you have ever run, with inline token bars and a duration × tokens scatter that makes outliers obvious. Filter by text, project, model or time window; export to CSV.

Sessions — sortable grid with duration × tokens scatter

Session forensics

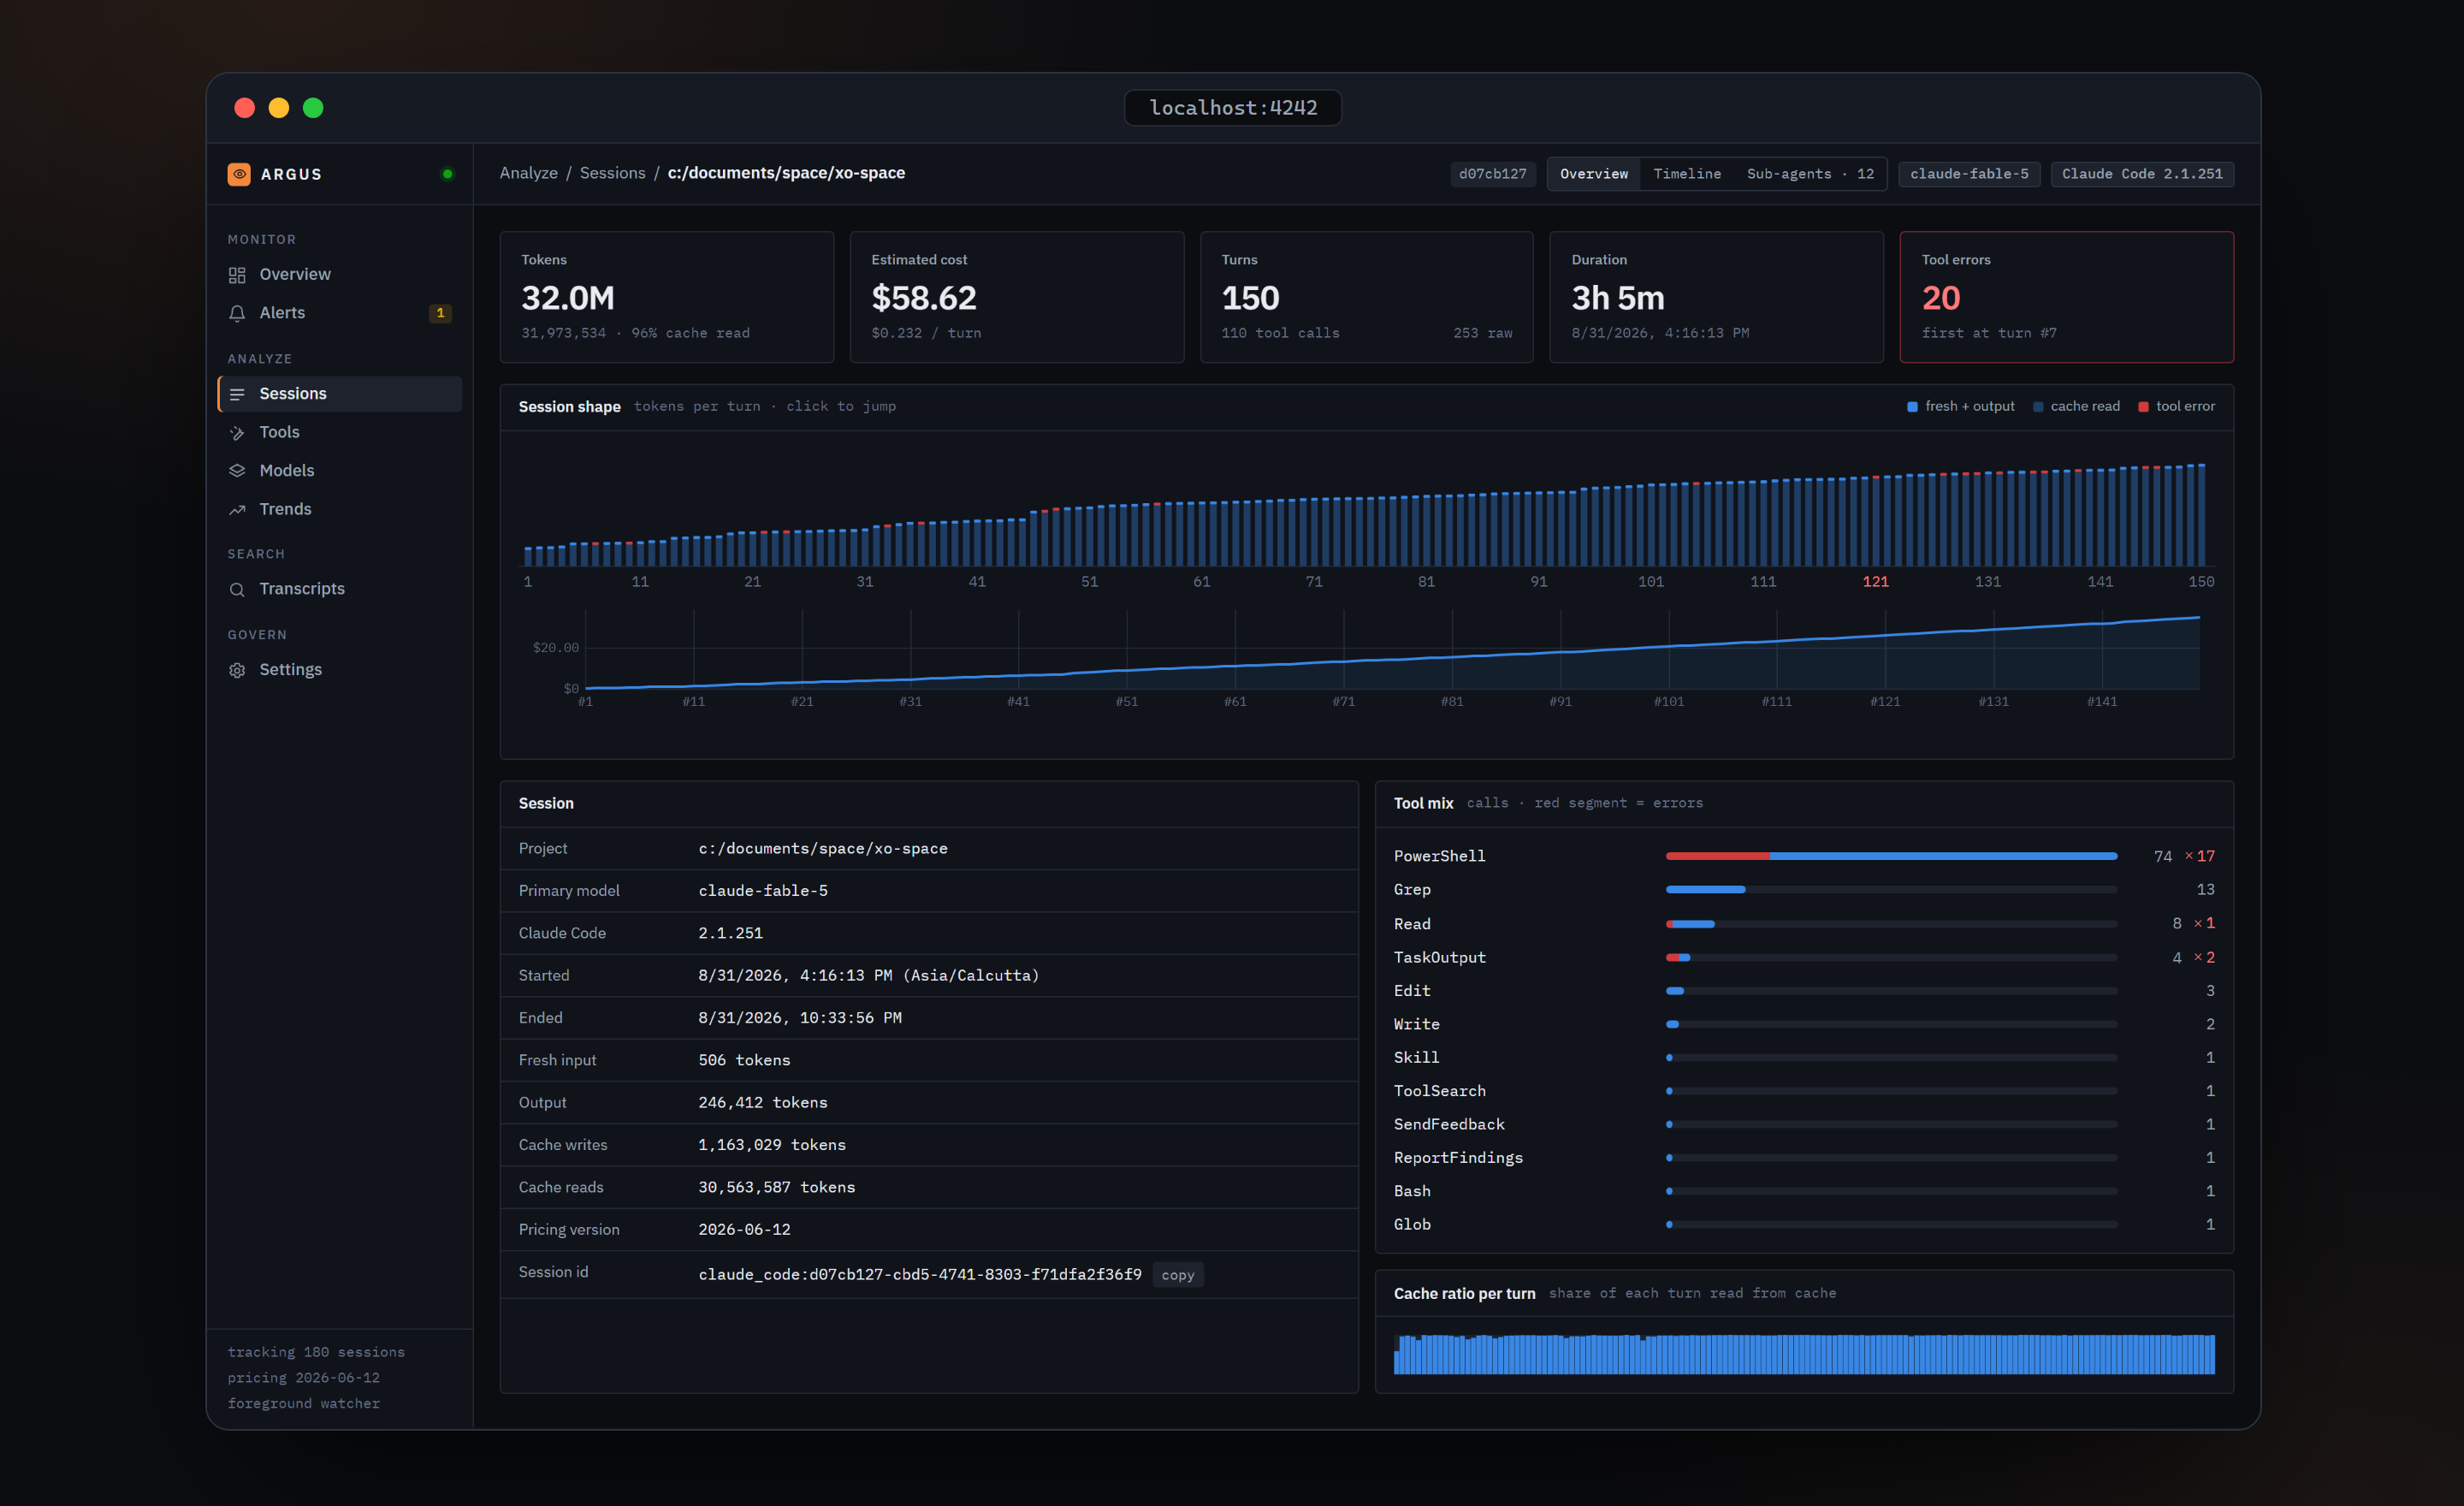
Click a session and you get its shape — one bar per turn, cache reads beneath fresh tokens, failing turns in red — plus a cumulative-cost line, a tool mix with error segments, and a timeline where every turn expands into its tool calls, sizes, status and error text inline.

Session detail — per-turn shape, cumulative cost, tool mix

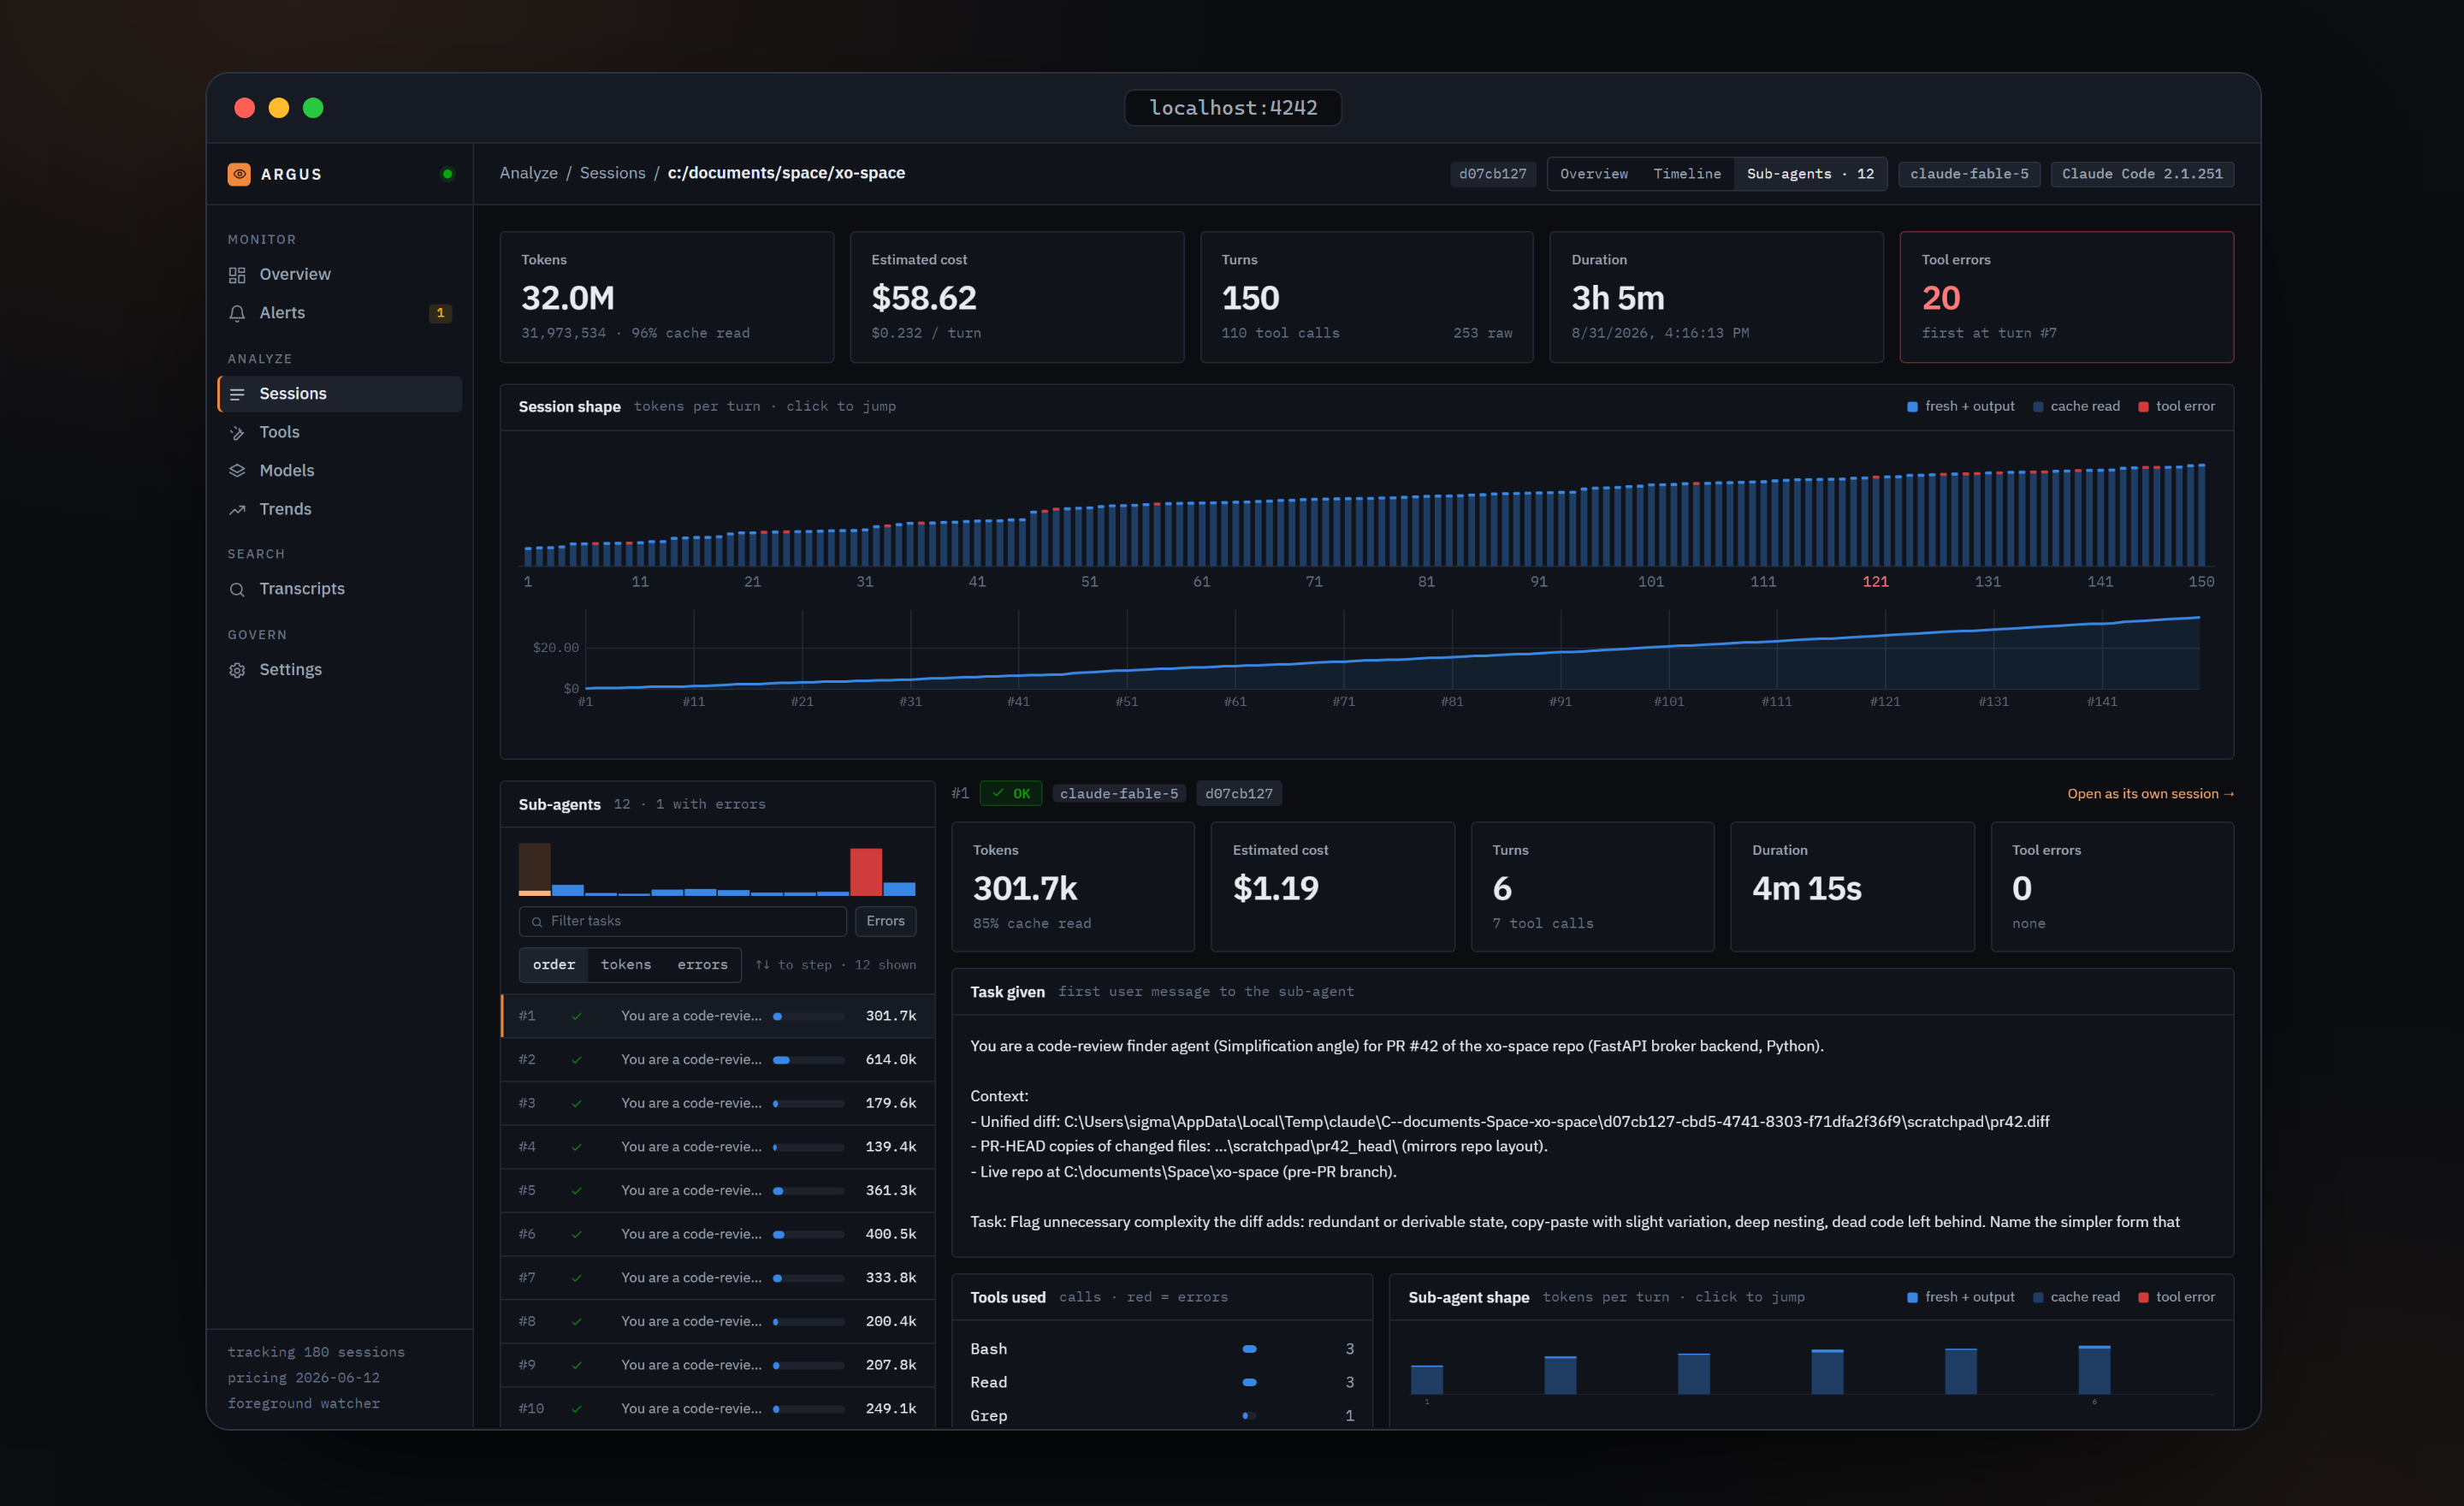
Sub-agent X-ray

When a session delegates to sub-agents, Argus keeps each one: the task as it was given, its tools, tokens, cost, shape and full timeline — with an at-a-glance strip that turns red where an agent failed. No more guessing what that Task call actually did.

Sub-agents — task given, tools used, per-agent shape and cost

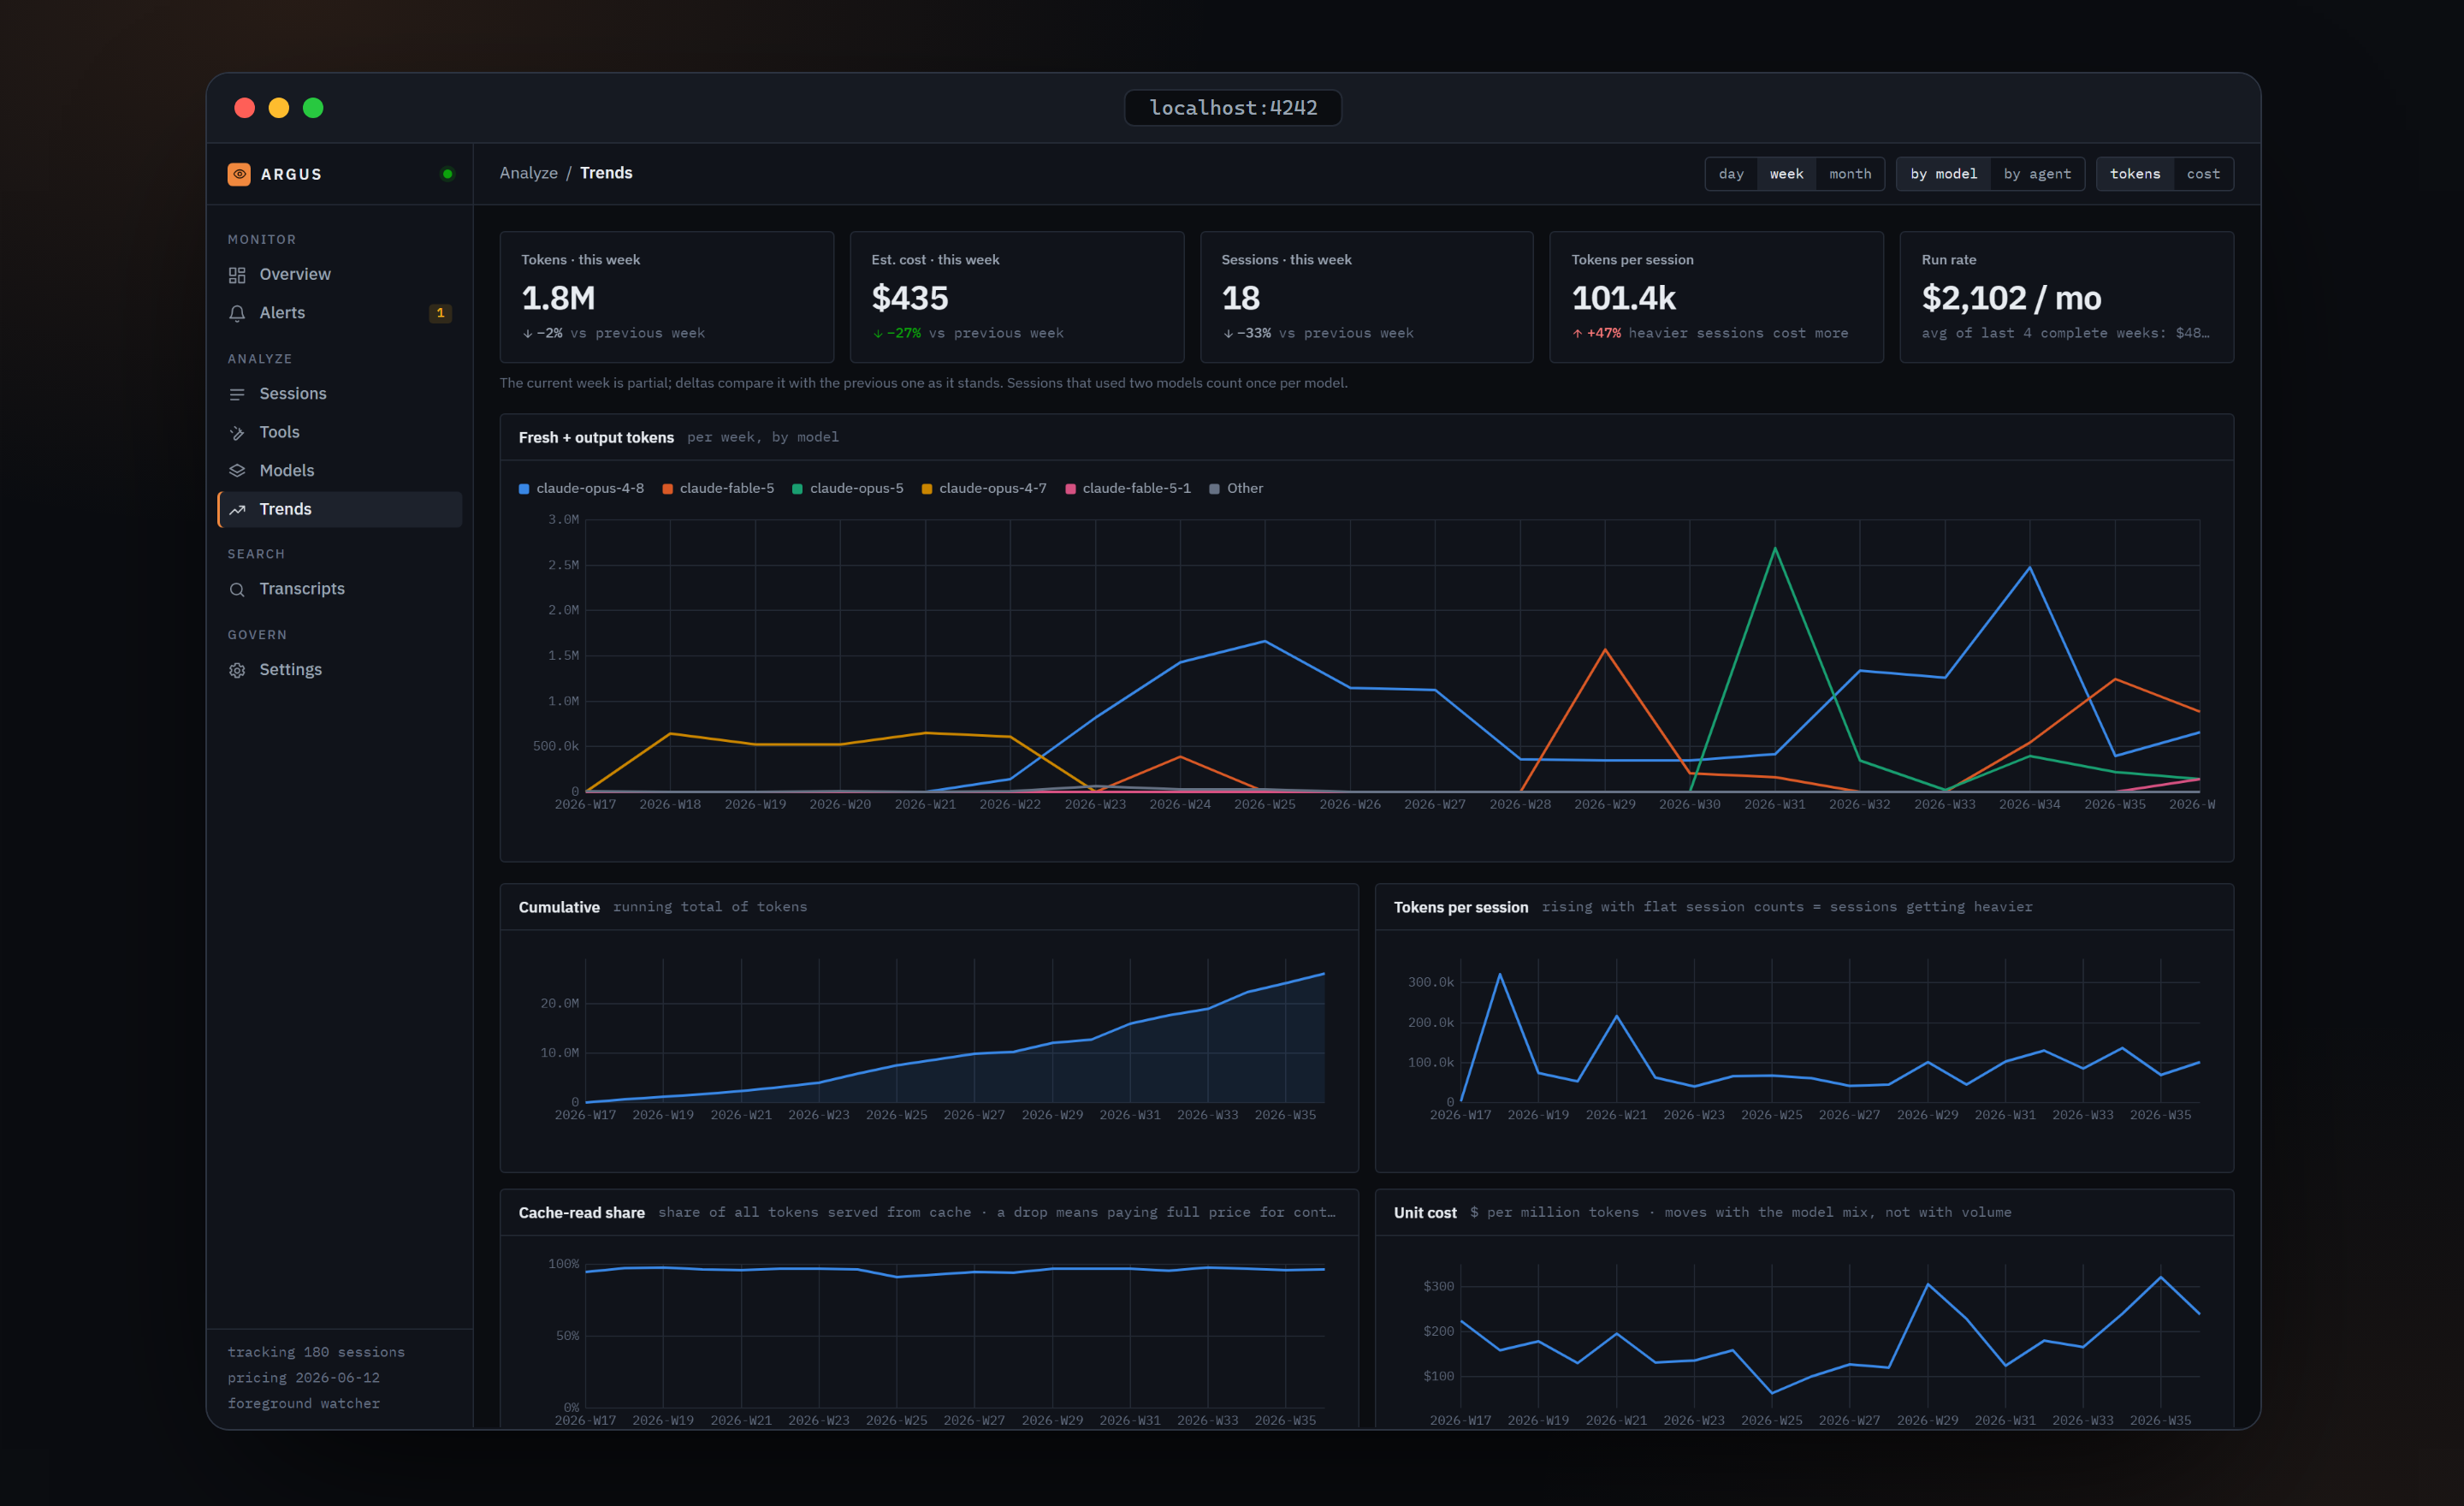
Trends that use rates, not totals

This period vs last, a monthly run-rate projection, tokens per session, cache-read share, and $ per million tokens as you actually experienced it — so you can tell "I am working more" apart from "each session got more expensive".

Trends — weekly tokens by model, run rate, unit cost

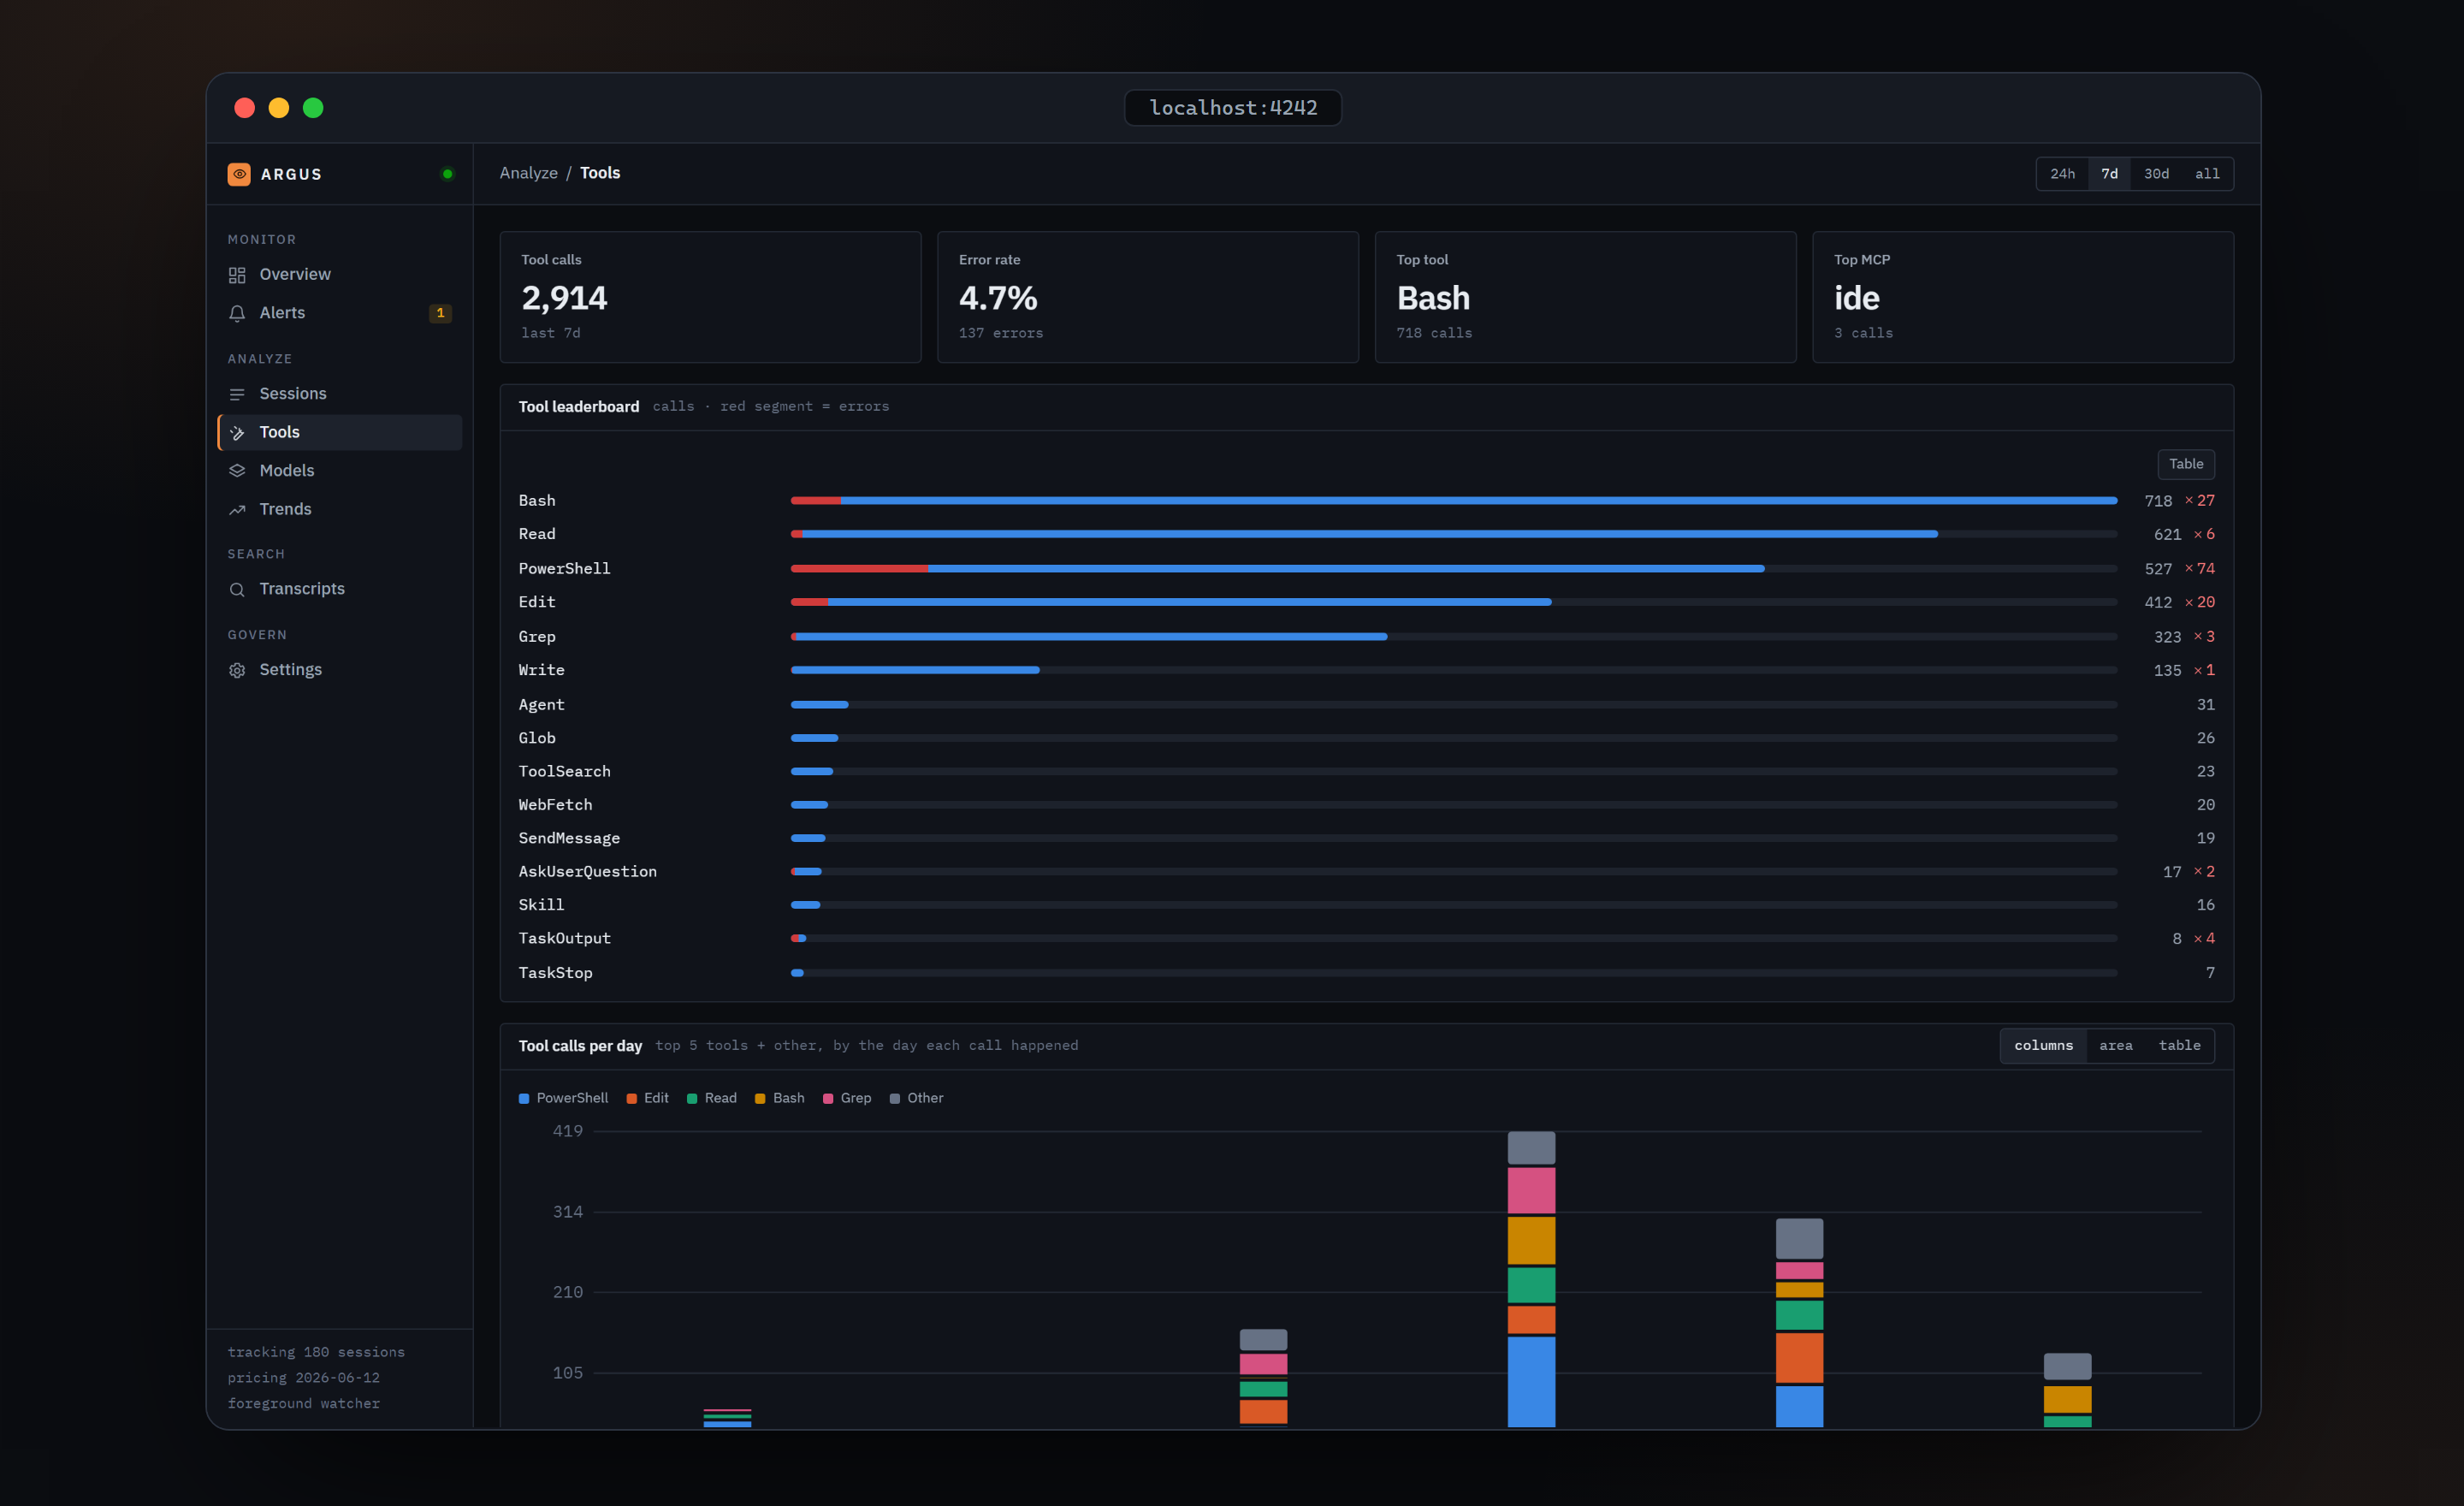
Tool health

A leaderboard of every tool with its error share, calls per day stacked by tool, MCP servers, and sub-agent invocations by type. A detector re-checks error rates every 10 minutes against a 4-week baseline and files an alert when a tool's failures double.

Tools — leaderboard with error segments and calls per day

Full-text search (opt-in)

Search every prompt you have typed and every assistant reply, thinking block and tool output. SQLite FTS5 — sub-millisecond, lexical, deterministic, offline. Off by default.

Privacy & security

Argus is built for one person on one machine, and the defaults say so.

  • Binds to 127.0.0.1 only.

    Nothing on your LAN, Wi-Fi or VPN can reach it.

  • No external requests, ever.

    Except argus pricing refresh, a manual command that fetches one JSON file. No telemetry, no analytics, no LLM calls.

  • Transcript indexing is opt-in.

    Cost and token analytics need no text content. Full-text search over prompts and transcripts requires an explicit opt-in.

Read the full privacy notes on GitHub