Alerts
The tool error-rate detector, its thresholds, and marking alerts seen.
Alerts are findings raised by detectors that re-check your data on a schedule. Today there is one detector, for tool error rates. At /alerts, or through the "All alerts" link on Overview.
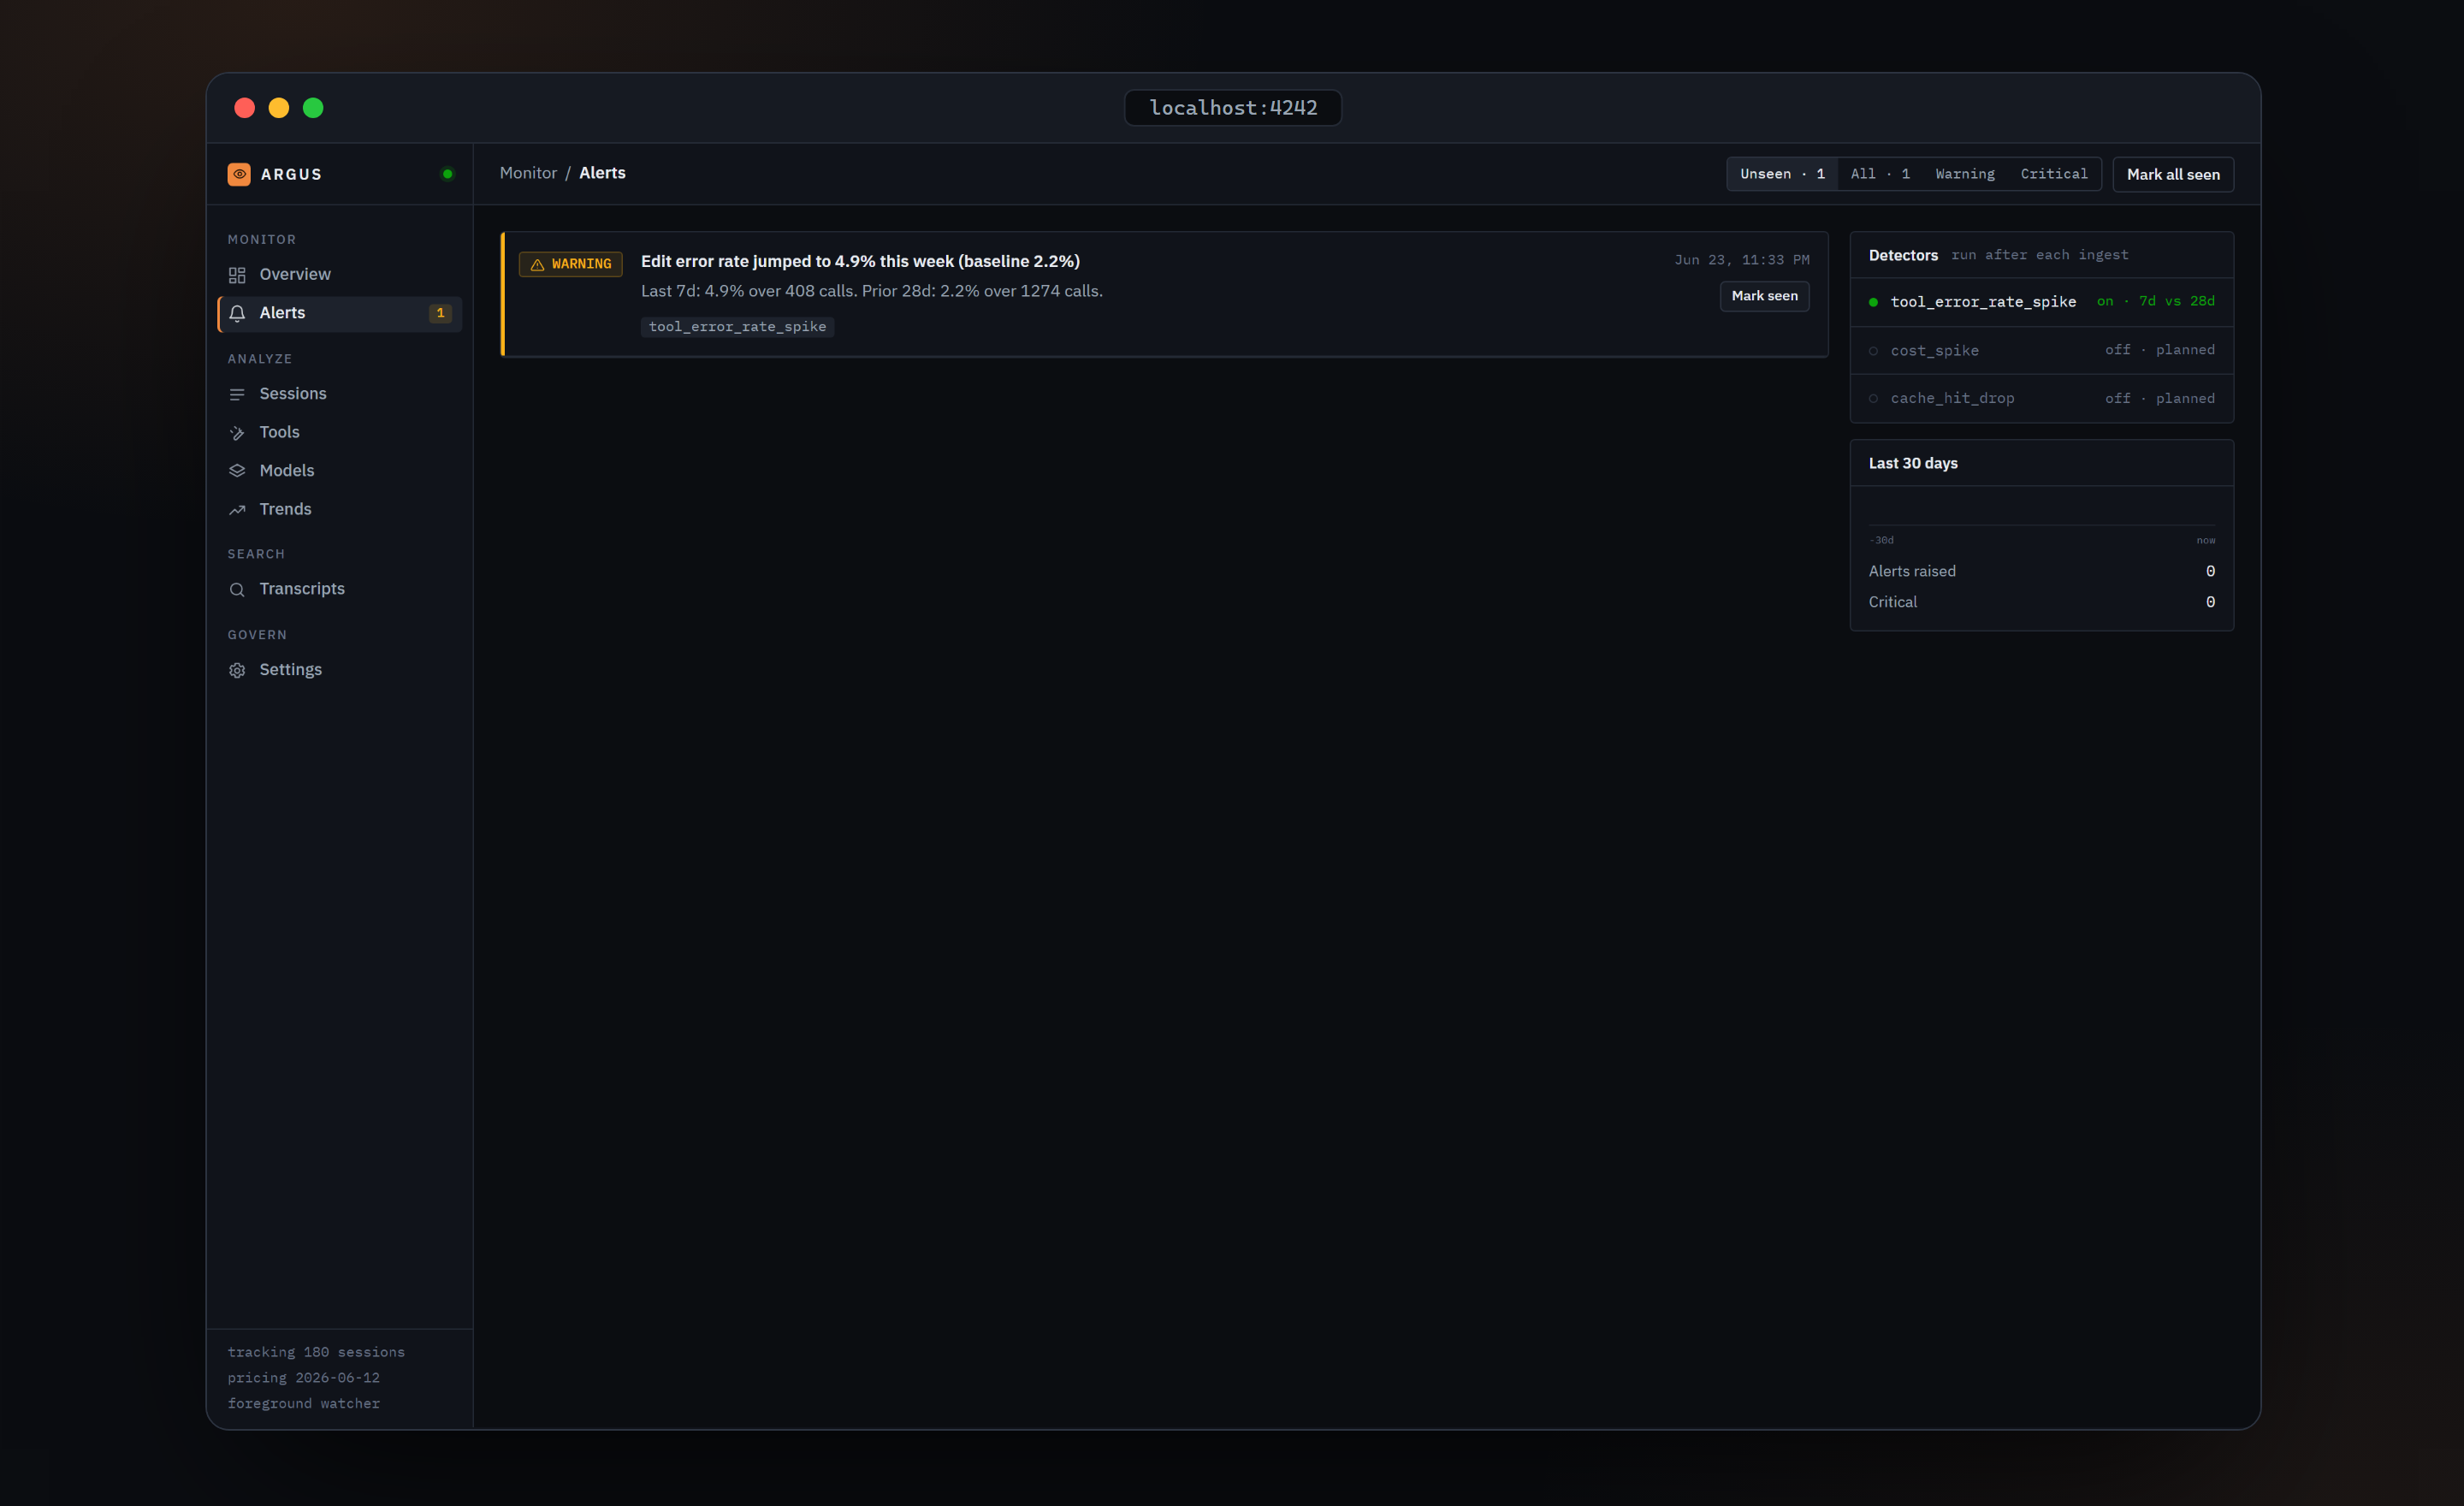
The list
The filter control offers Unseen · 1, All · 1, Warning, and Critical; the default is Unseen. Mark all seen is on the right and is disabled when nothing is unseen.
Each row shows a severity pill (INFO, WARNING or CRITICAL), the title, the message, the detector name in monospace, a tool=Edit chip when the alert is about a tool, the time, and either a Mark seen button or a muted "seen" pill. Unseen rows carry a coloured rail on the left, blue, amber or red by severity; seen rows are dimmed.
The empty state is a green ALL CLEAR pill with "nothing recorded", "nothing unseen", "nothing warning" or "nothing critical" depending on the filter.
What marking seen means
You acknowledge alerts; you never delete them. An alert stays in the list until its condition clears, at which point the next detector run marks it resolved and it drops out of the default views. If the same condition comes back later, or a warning escalates to critical, the alert is re-raised as unseen so you notice it again.
Detectors
The panel on the right lists three:
| Detector | State |
|---|---|
tool_error_rate_spike | on, "7d vs 28d" |
cost_spike | off, planned |
cache_hit_drop | off, planned |
The panel's sub-label says the detectors "run after each ingest". They actually run on a timer: once when Argus or the daemon starts, then every 10 minutes.
The tool error-rate detector
For every tool it compares two periods: the window, the last 7 days, and the baseline, the 28 days before that. A tool is only considered when it has at least 20 calls in each period, which keeps rarely used tools from producing noise.
| Case | Result |
|---|---|
| Baseline had zero errors and the window rate is at least 5 percent | Critical, titled Edit started failing this week (no prior errors) |
| Window rate ÷ baseline rate is at least 2 | Warning |
| Window rate ÷ baseline rate is at least 5 | Critical |
| Anything else | No alert |
The title for the ratio cases reads Edit error rate jumped to 4.7% this week (baseline 2.1%) and the message Last 7d: 4.7% over 427 calls. Prior 28d: 2.1% over 1262 calls. The alert's metadata keeps the tool name, both rates, both call counts and the multiple.
Sub-agent tool calls count towards these rates, since each call is its own row.
Cost was deliberately not the first signal: it is meaningless for subscribers who do not pay per token.
Last 30 days
A strip of dots on a time axis from -30d to now, one per alert, sized and coloured by severity. Below it, two counters: alerts raised and critical.
Browser notifications
The dashboard raises a browser notification for unseen critical findings, and the sidebar's Alerts badge shows the unseen count, refreshed every 10 seconds.
Verified against argus-code 0.5.2.