Tools
Tool leaderboard, error rate, calls per day, MCP servers and sub-agent invocations.
Which tools Claude called, how often they failed, and which MCP servers and sub-agent types were involved. At /tools; the window control defaults to 7d.
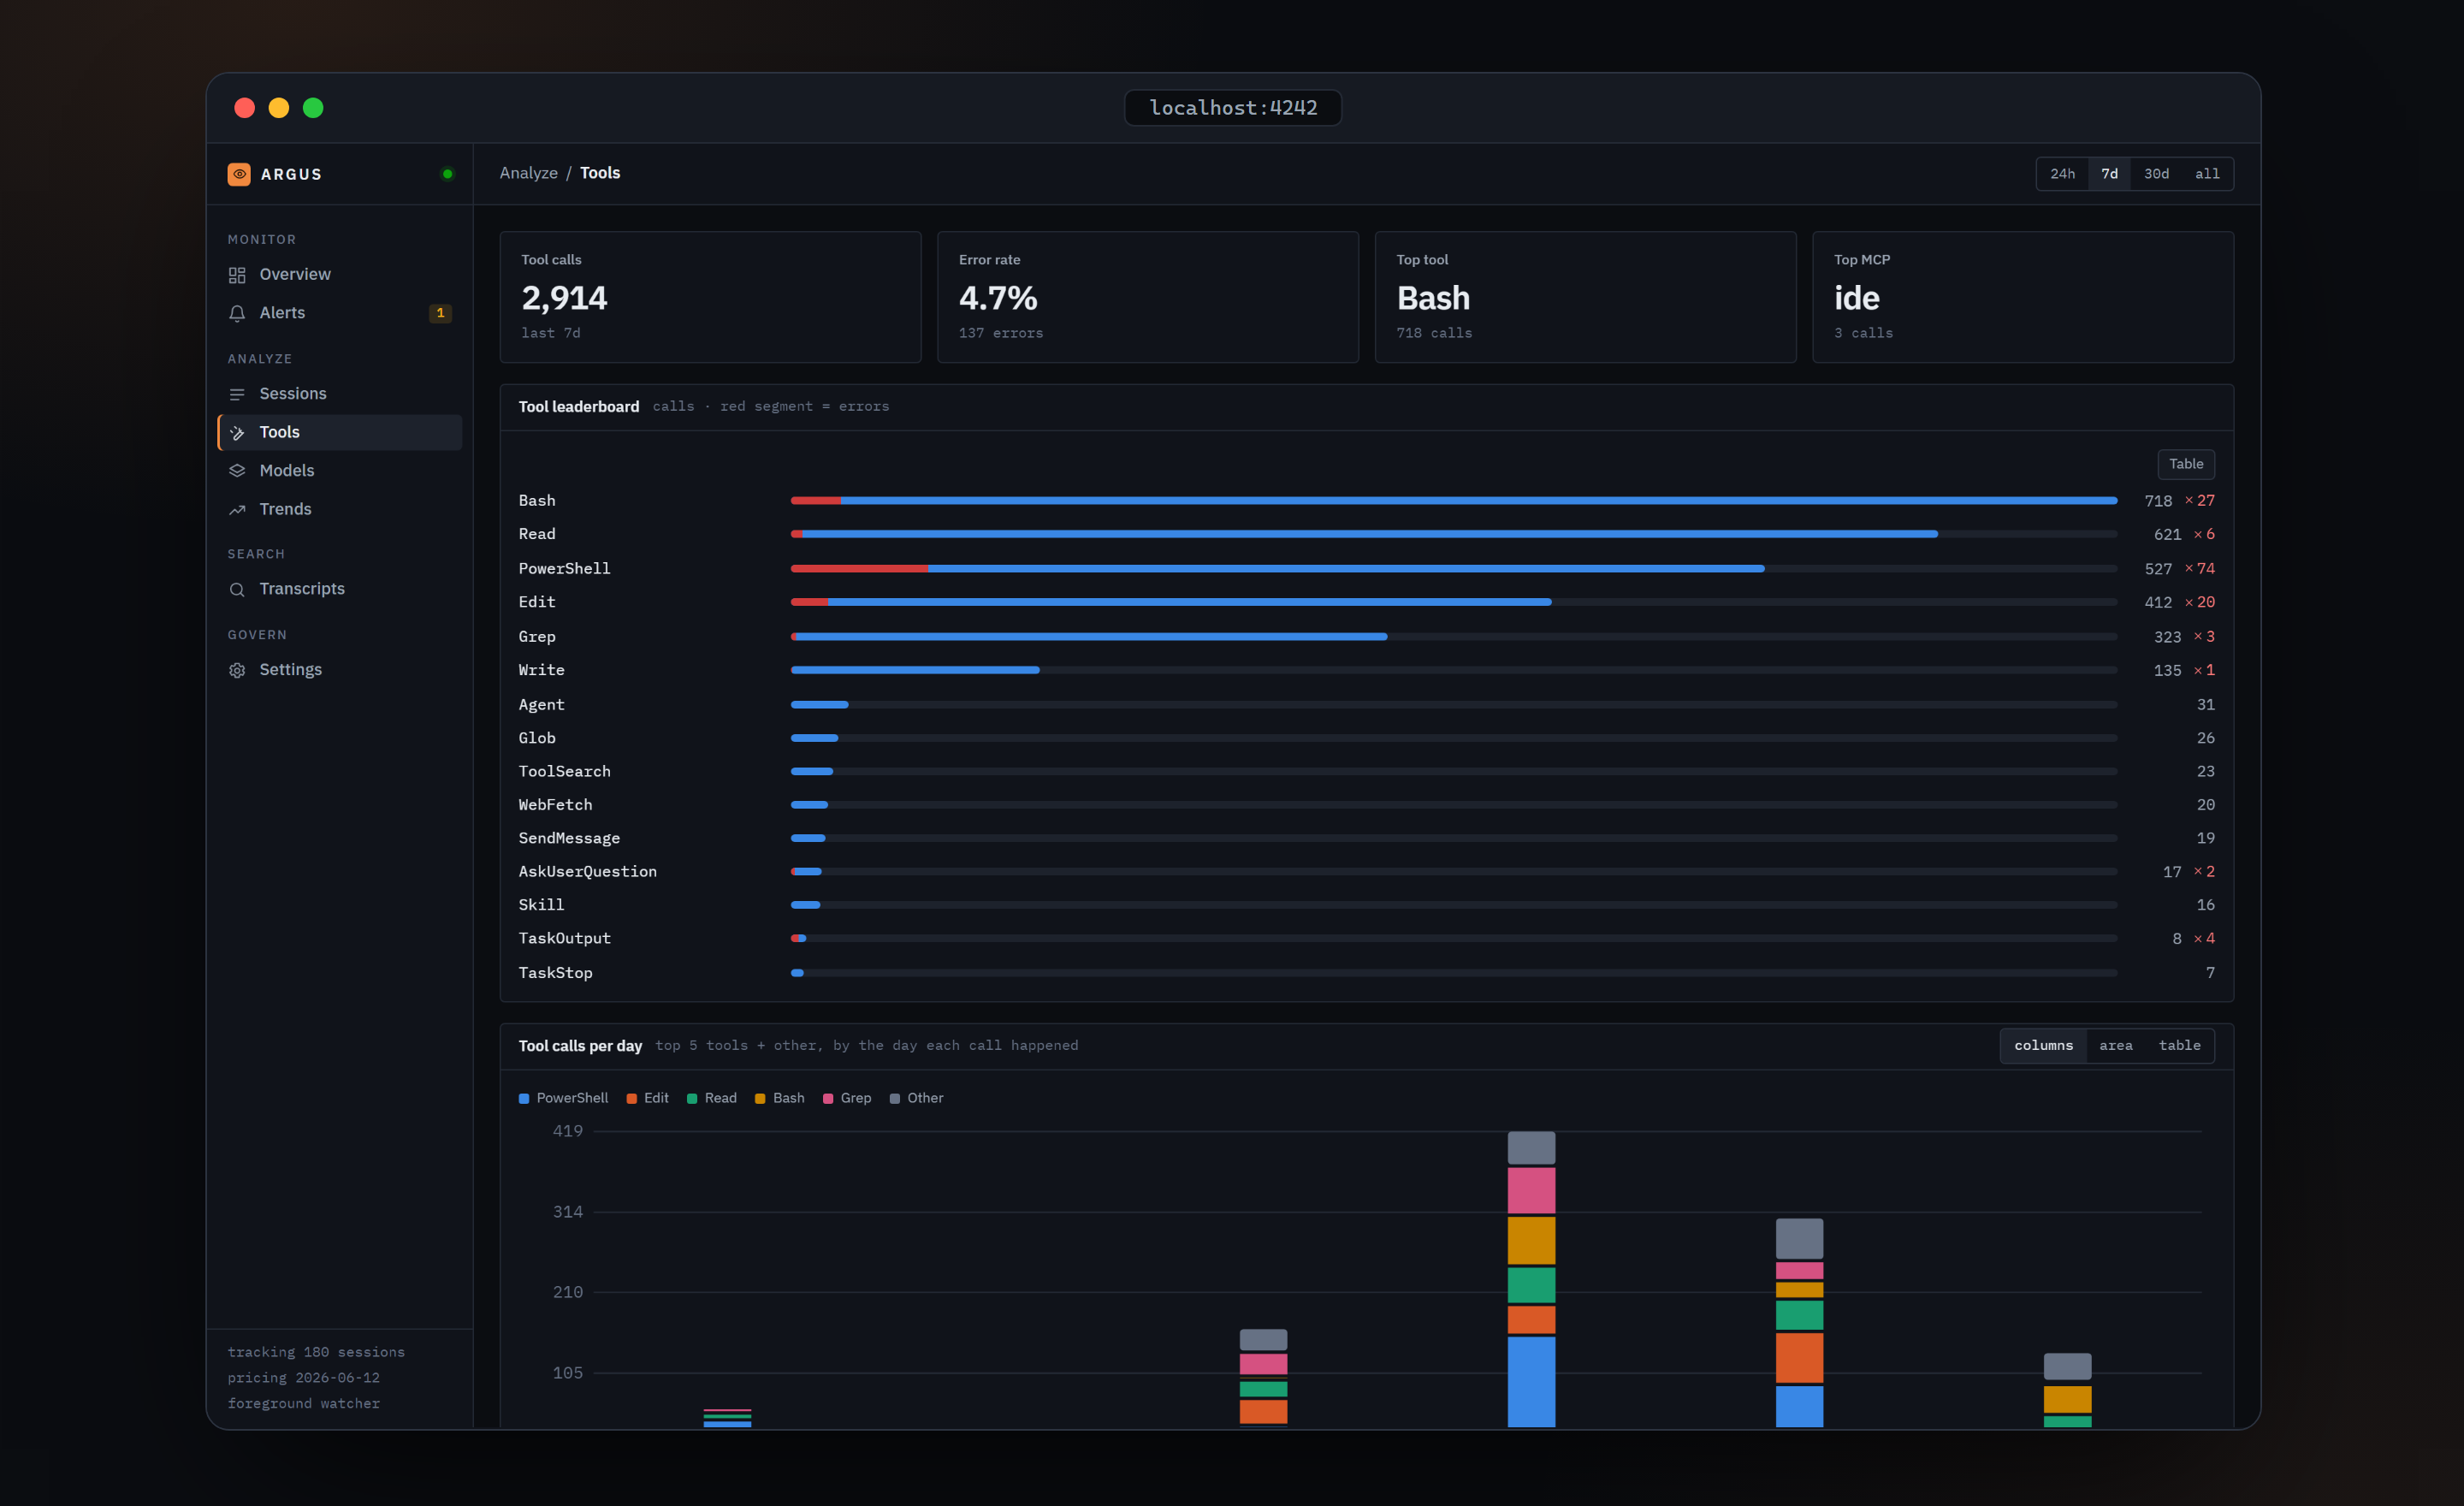
Four tiles
| Tile | Meaning |
|---|---|
| Tool calls | Every tool call in the window |
| Error rate | Failed calls ÷ all calls, with the error count below. The whole tile turns red above 5 percent |
| Top tool | The most-called tool and its count |
| Top MCP | The busiest MCP server, or "no MCP calls" |
A call is an error when its result block in the transcript was flagged as one, which is how Claude Code records a tool that returned a failure.
Tool leaderboard
Bars for the 15 most-called tools. The red overlay on a bar is the error count on the same scale, followed by ✕ 12. The Table toggle lists tool, calls, errors and error rate for up to 20 tools, with the rate rounded to two decimals.
Tool calls per day
Top five tools plus Other, stacked by the day each call happened. Each call is attributed to the local day of its own turn, so a session that ran overnight spreads correctly across two days. Views: columns, area, table.
This chart is computed in the browser from individual session timelines, so it is only available for windows of at most 30 days with at most 60 sessions. Outside that it reads "Narrow the window to see this chart. (A server-side aggregate is planned.)"
MCP servers
Tools from MCP servers are named mcp__server__tool in transcripts. This panel groups calls by the server segment, with the same red error overlay. Elsewhere in the dashboard these tools display as server · tool.
Sub-agent invocations
Calls to the Task or Agent tool grouped by the sub-agent type that was requested. To see what a particular sub-agent did, open its parent session's Sub-agents tab.
Tools feed the alert detector
The one shipped detector watches per-tool error rates and raises an alert when a tool's rate doubles against its baseline. See Alerts.
Verified against argus-code 0.5.2.