Overview
Tiles, deltas, tokens per day, models, activity heatmaps and top sessions.
The home page at /. Reach it from the sidebar, the logo, or Ctrl+K.
The window control
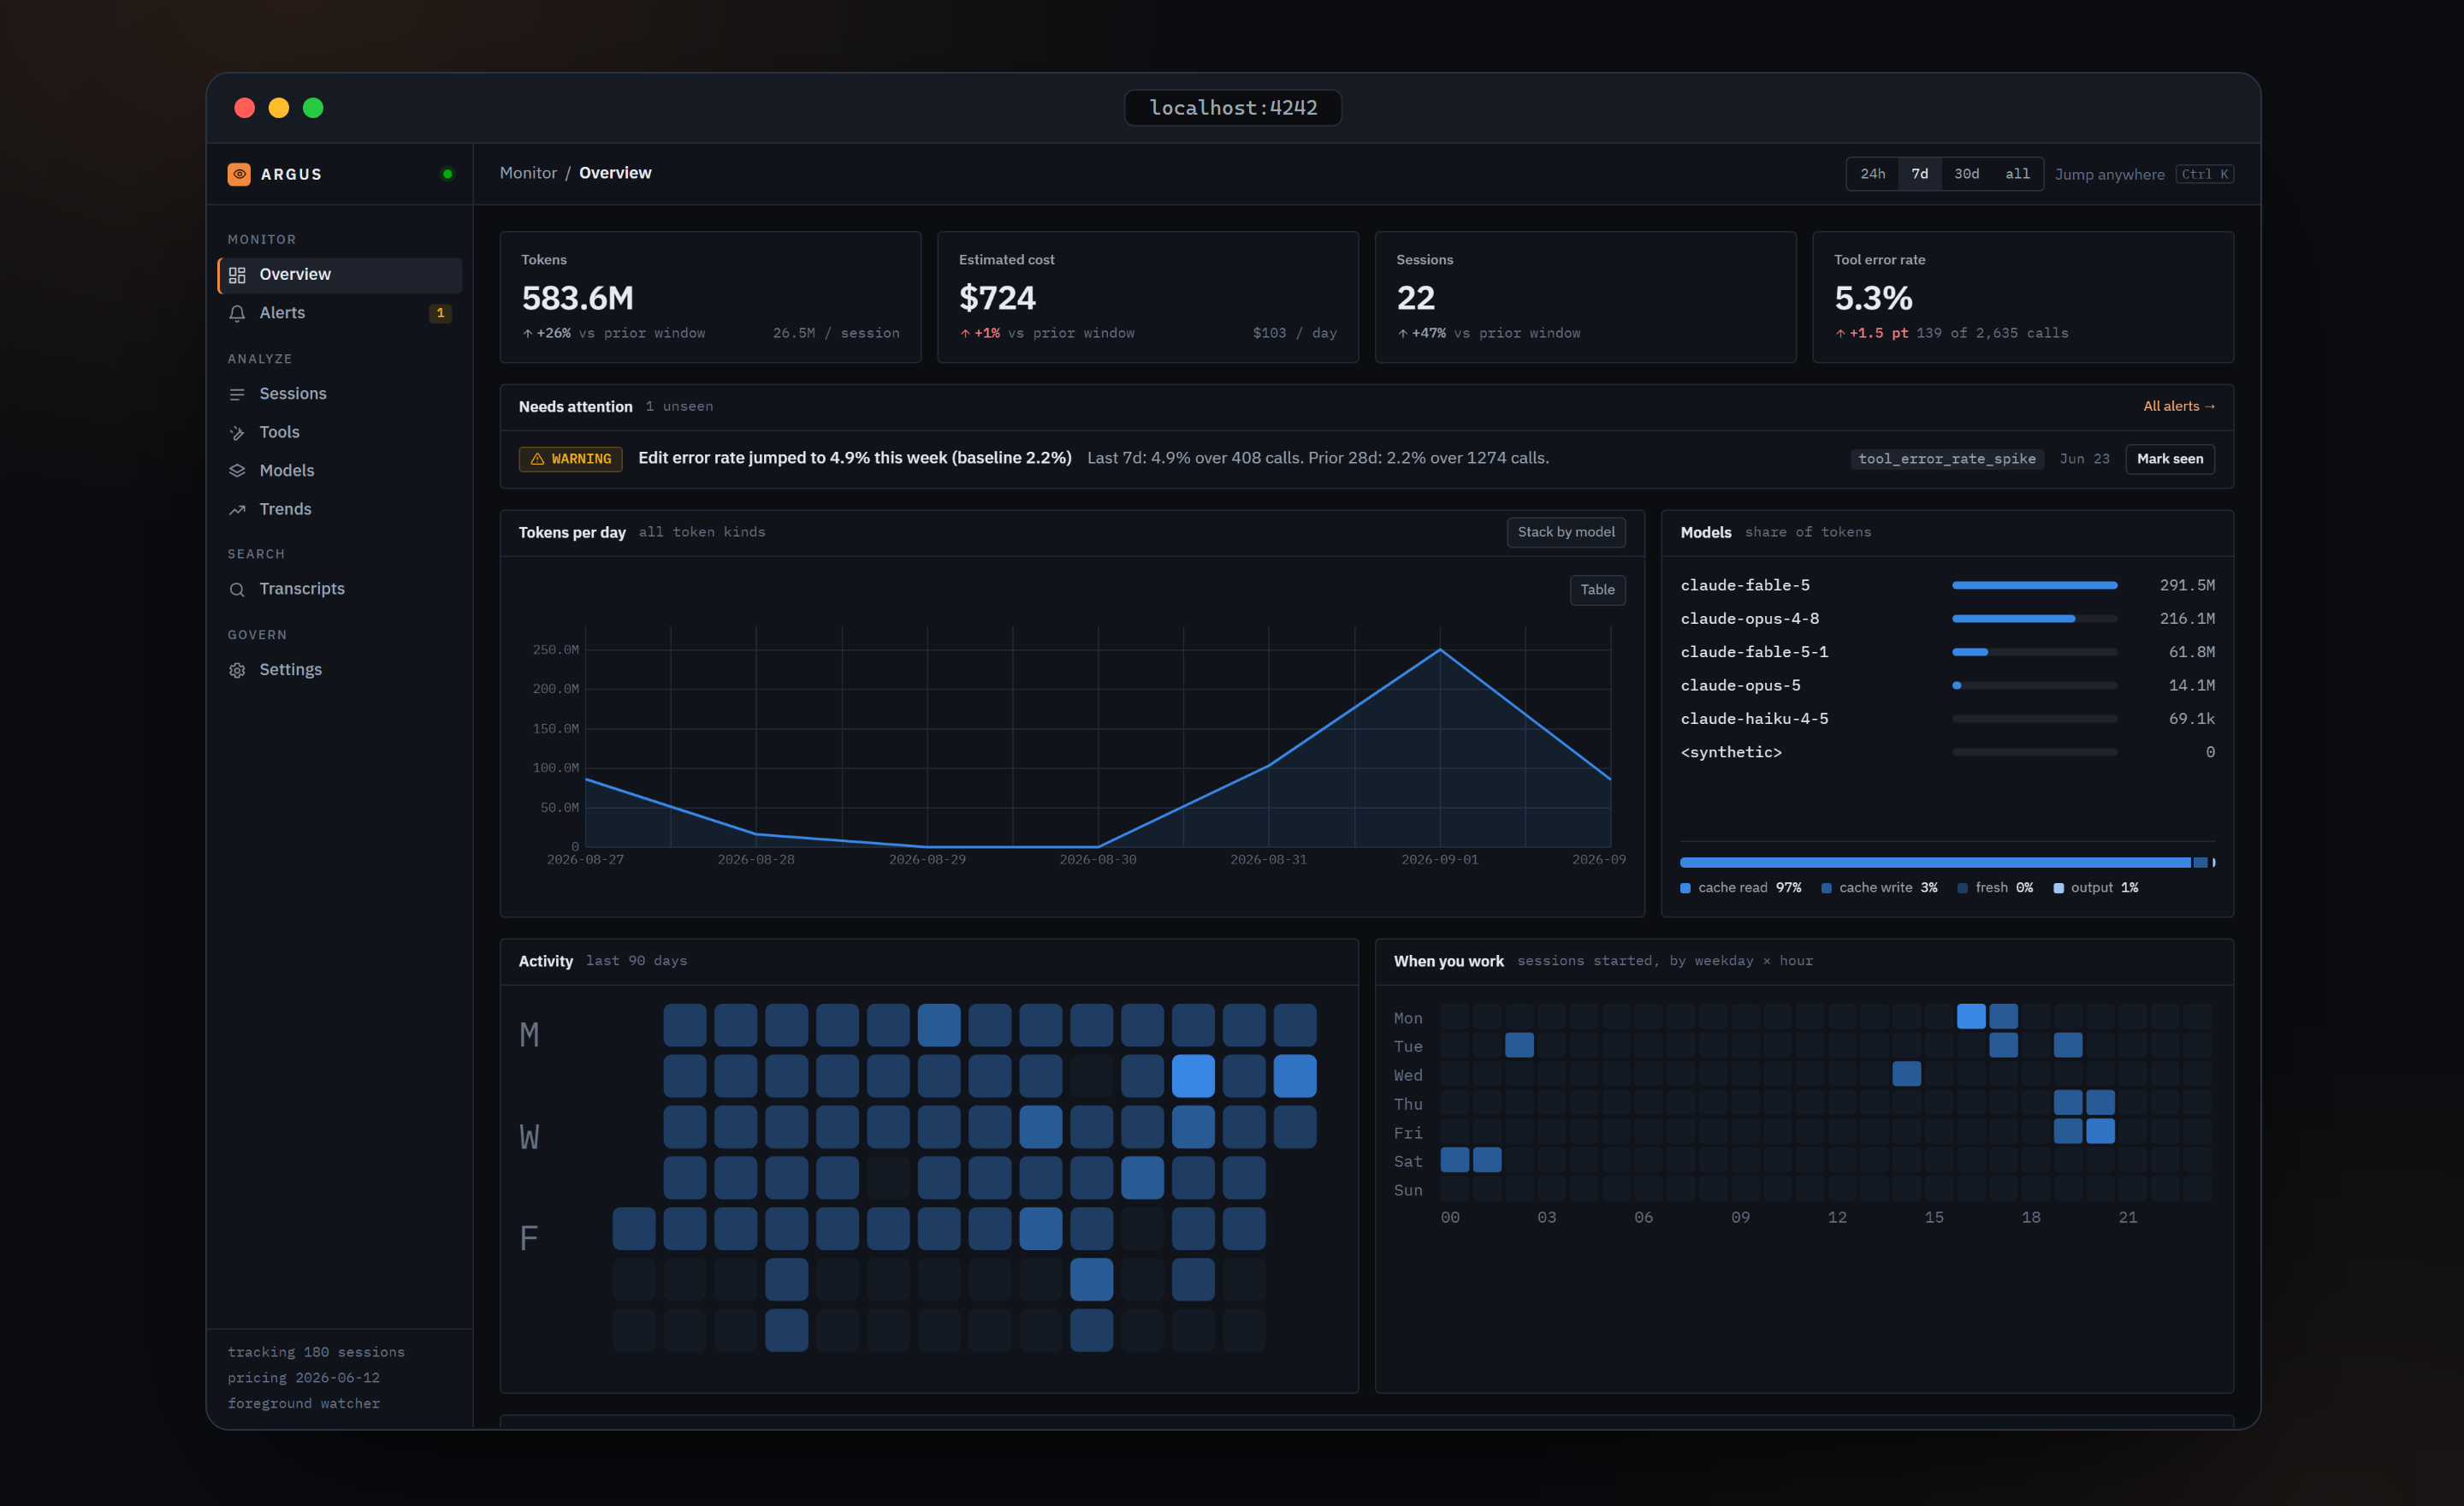
Top right: 24h, 7d, 30d, all. The default is 7d. Every tile and most panels follow it; the exceptions are noted below.
The four tiles
| Tile | Value | Note under it |
|---|---|---|
| Tokens | All four token kinds (fresh input, output, cache read, cache write) summed over every turn in the window | Average per session |
| Estimated cost | Sum of per-turn cost in the window | Cost per day |
| Sessions | Number of distinct sessions that had at least one turn inside the window, so a long session that started earlier still counts | |
| Tool error rate | Failed tool calls ÷ all tool calls in the window | 137 of 2,914 calls |
Each tile compares against the immediately preceding window of the same length and shows the change as a percentage, or as an absolute difference when the prior value is zero. The tool error rate delta is shown in percentage points, for example +0.8 pt. For cost and error rate a rise is red and a fall is green; for tokens and sessions the arrow is neutral. The all window shows no deltas.
The Sessions tile counts sessions active in the window, but its delta is computed from sessions started in each window. The two can disagree when long sessions straddle the boundary.
Needs attention
Up to three unseen alerts, each with a severity pill, the title, the message, the detector name and a Mark seen button, plus a link to all alerts. When nothing is unseen it shows a green ALL CLEAR pill and either the last alert's date and title or "no alerts recorded yet". See Alerts.
Tokens per day
One blue line of all token kinds per day. The Stack by model chip switches to stacked columns of the top five models plus Other, and the sub-label changes to "fresh + output, by model" because the stacked view counts only fresh input and output tokens. Both views have a Table toggle.
Models
Horizontal bars of tokens by model, largest first. Below a divider, a composition meter splits all tokens in the window into four parts, each labelled with its share: cache read, cache write, fresh, output.
The bars come from turns in the window; the meter is built from sessions that started in the window. For long-running sessions the two can differ slightly.
Activity
A calendar heatmap of tokens per day over the last 90 days, regardless of the window control. Rows are weekdays with M, W and F labelled; hover a cell for the date and token count.
When you work
A 7 × 24 grid of sessions started by local weekday and hour. Monday is the top row, columns are hours 00 to 23 with every third hour labelled. Hover a cell for a value like Mon 09:00 · 3.
Top sessions
The eight heaviest sessions by tokens inside the window, with started date, project, model, a token bar and estimated cost. A session with turns on more than one day shows a +2d badge after its date. Click a row, or press Enter with it focused, to open the session. The link on the right goes to the full Sessions list.
Two definitions of a day
The tiles ask the server for a rolling window, so 24h means the last 24 hours. The client-side panels, such as the composition meter and the weekday grid, filter by local calendar day, so there 24h means since midnight. The server also buckets days in UTC while the client labels them in local time. For most people the difference is invisible; if you work near midnight or far from UTC, a day's worth of tokens can shift into a neighbouring bucket.
Verified against argus-code 0.5.2.