Trends
Period-over-period tokens and cost, run rate, tokens per session, cache-read share.
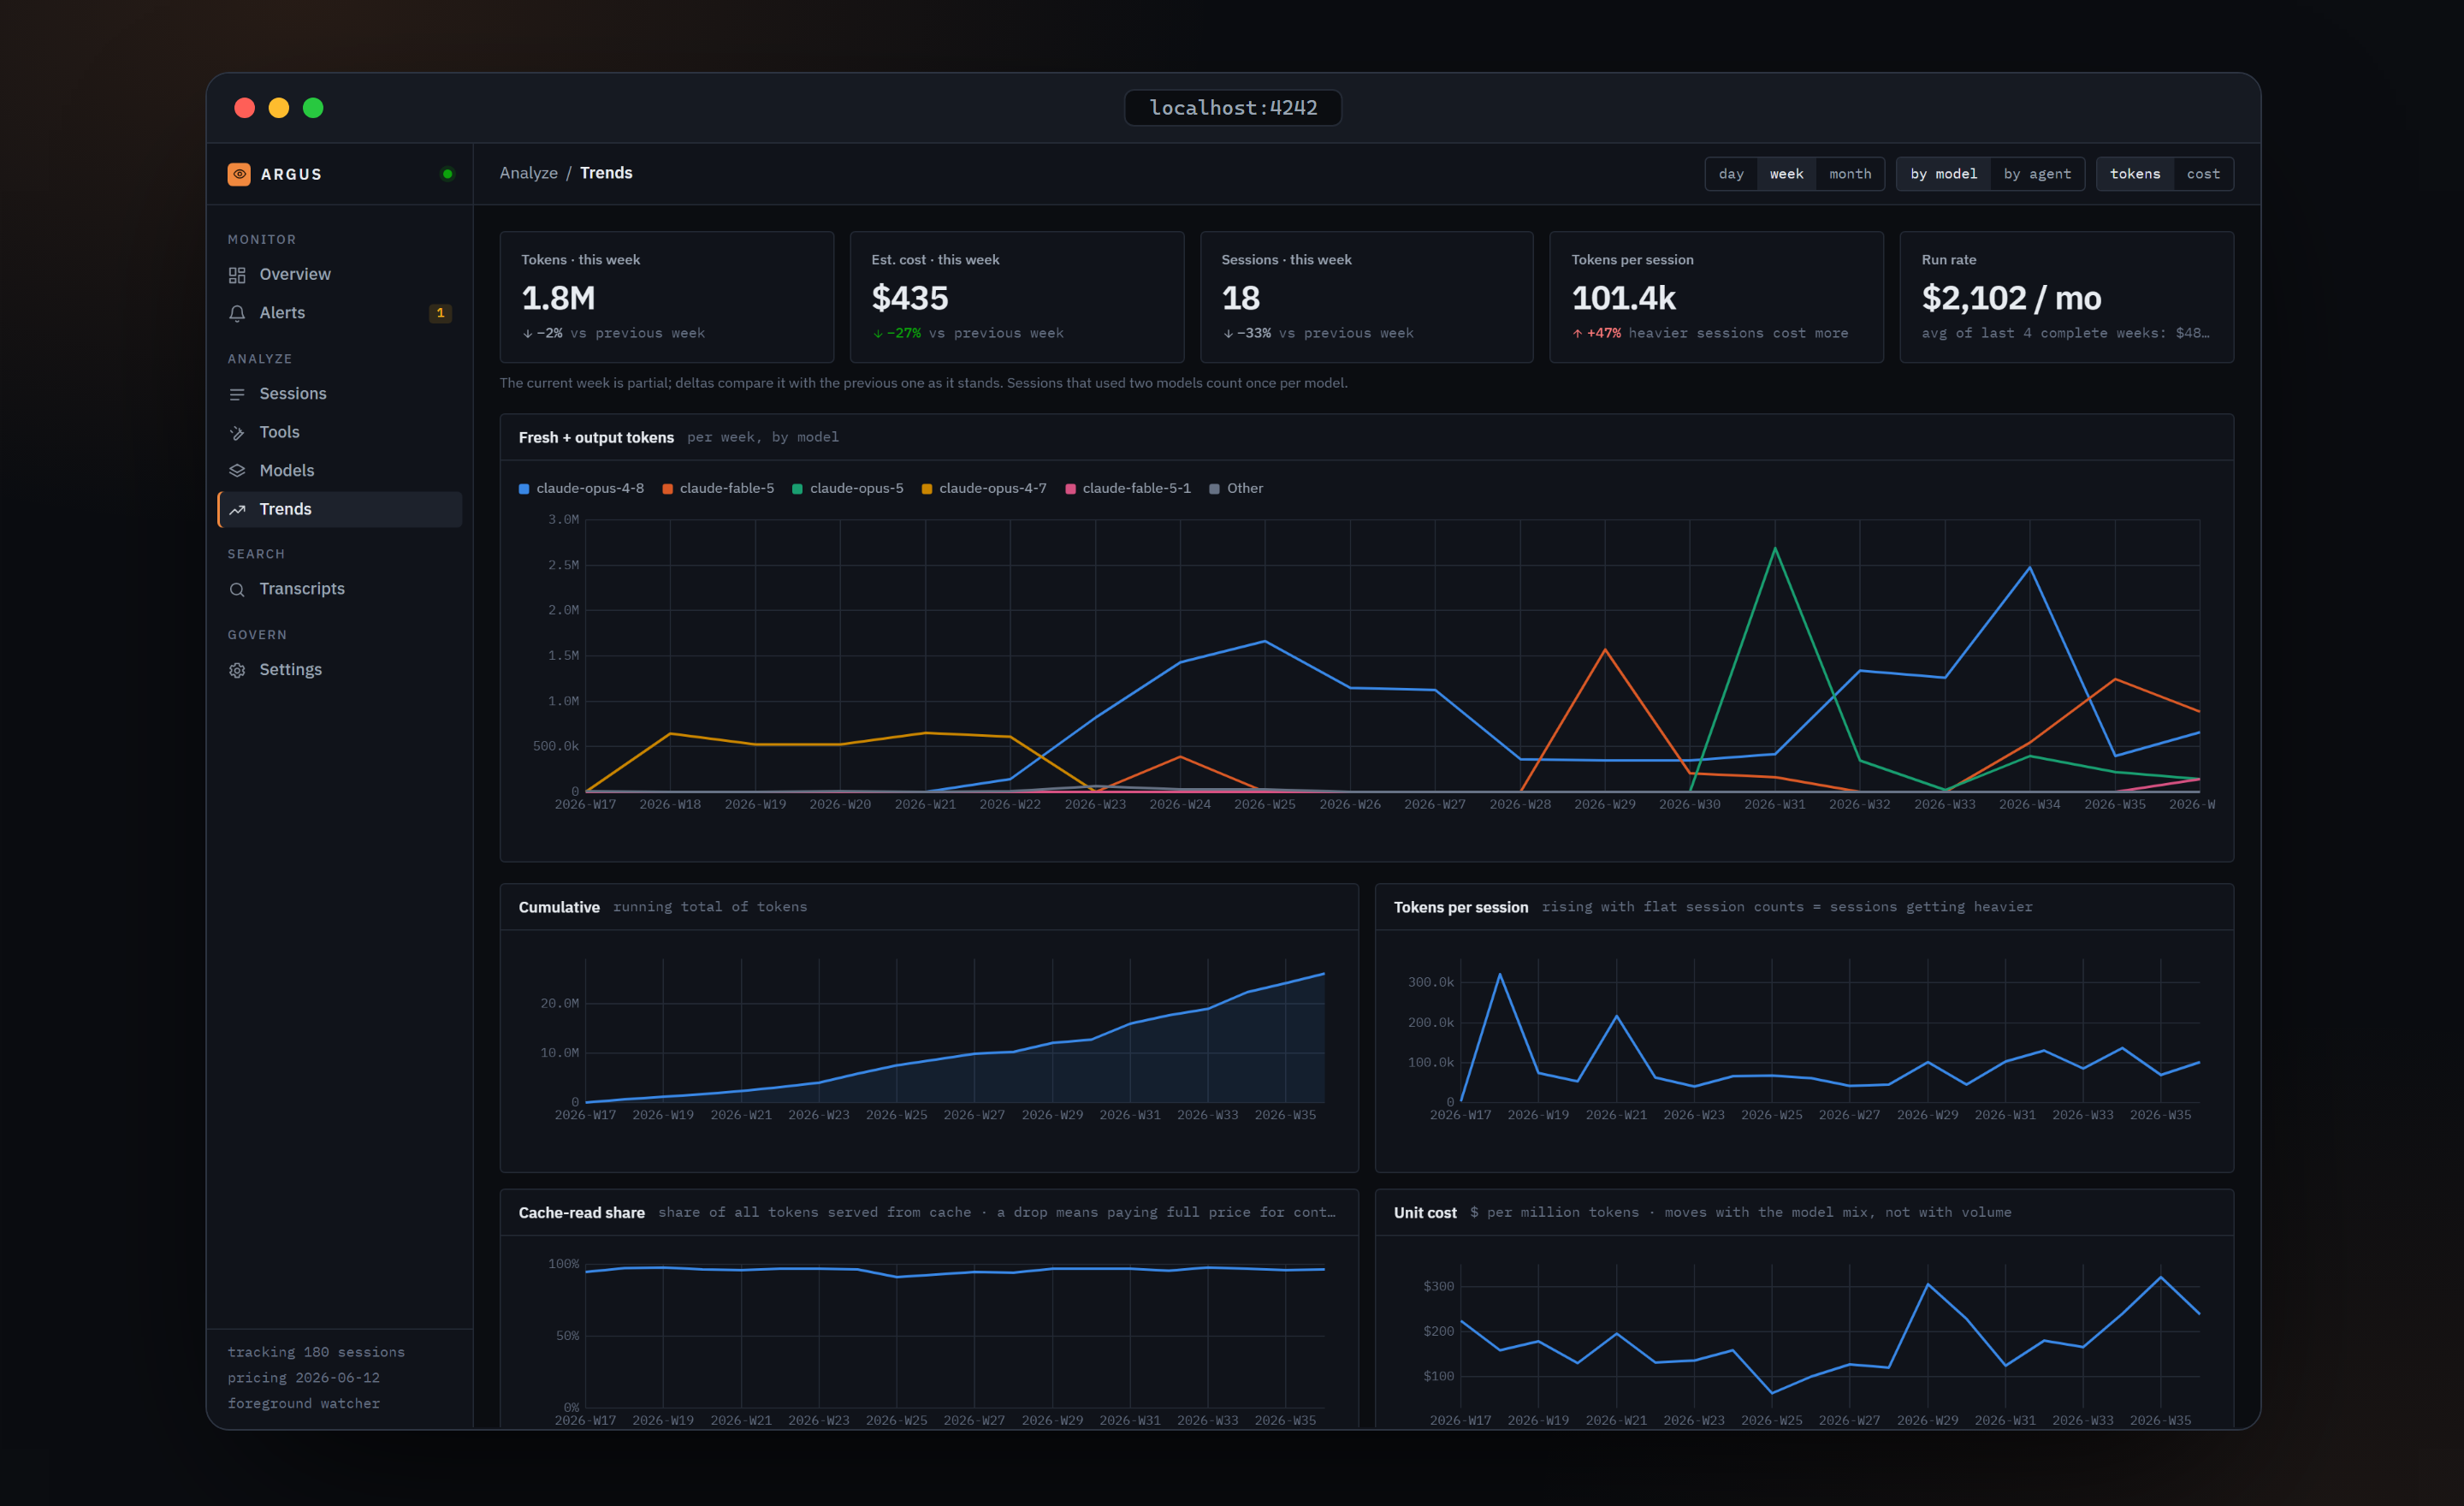
Trends answers "is this getting more expensive?" with rates rather than totals, so you can tell working more apart from each session costing more. At /trends.
Controls
Three segmented controls in the top bar:
| Control | Options | Default |
|---|---|---|
| Granularity | day, week, month | week |
| Grouping | by model, by agent | by model |
| Measure | tokens, cost | tokens |
What the numbers are built from
Every panel except one is built from turns bucketed by UTC date, and the token figure counts only fresh input plus output. Cache reads and writes are excluded here on purpose, because they track context size rather than work done. Week keys are ISO-style, counted from the first of January in UTC.
Five tiles
| Tile | Meaning |
|---|---|
| Tokens · this week | Fresh plus output tokens in the current period, with the change from the previous period |
| Est. cost · this week | Same for cost; a rise is red |
| Sessions · this week | Per-group counts summed, so a session that used two models counts twice |
| Tokens per session | Period tokens ÷ period sessions. Rising with flat session counts means sessions are getting heavier |
| Run rate | The mean cost of the last up to four complete periods, multiplied out to a month: 30.4 days, 4.35 weeks, or 1 month. The current partial period is excluded. Reads "needs 2+ periods" until there is enough history |
Under the tiles, a caveat line: "The current week is partial; deltas compare it with the previous one as it stands. Sessions that used two models count once per model."
Charts
- Fresh + output tokens, or Estimated cost when the measure is cost: a line per group, top five plus Other, with a legend.
- Cumulative: a running total of the chosen measure.
- Tokens per session: the ratio per period. Rising while session counts stay flat means each session got heavier.
- Cache-read share: the share of all tokens served from cache, on a fixed 0 to 100 percent axis. A drop means paying full price for context.
- Unit cost: dollars per million tokens per period. This moves with the model mix, not with volume.
Cache-read share is computed from sessions bucketed by their start time, while the other panels are built from turns. It is the one series on this page that can drift a little from the others for sessions that span a period boundary.
Breakdown
A table with one row per period: the period, one column per series, the total, sessions, tokens per session, cache read share, and dollars per million tokens.
Verified against argus-code 0.5.2.