Models
Tokens, cost and price efficiency per model, and model share over time.
Which models you used, what they cost, and how that mix changed over time. At /models; the window control defaults to 30d.
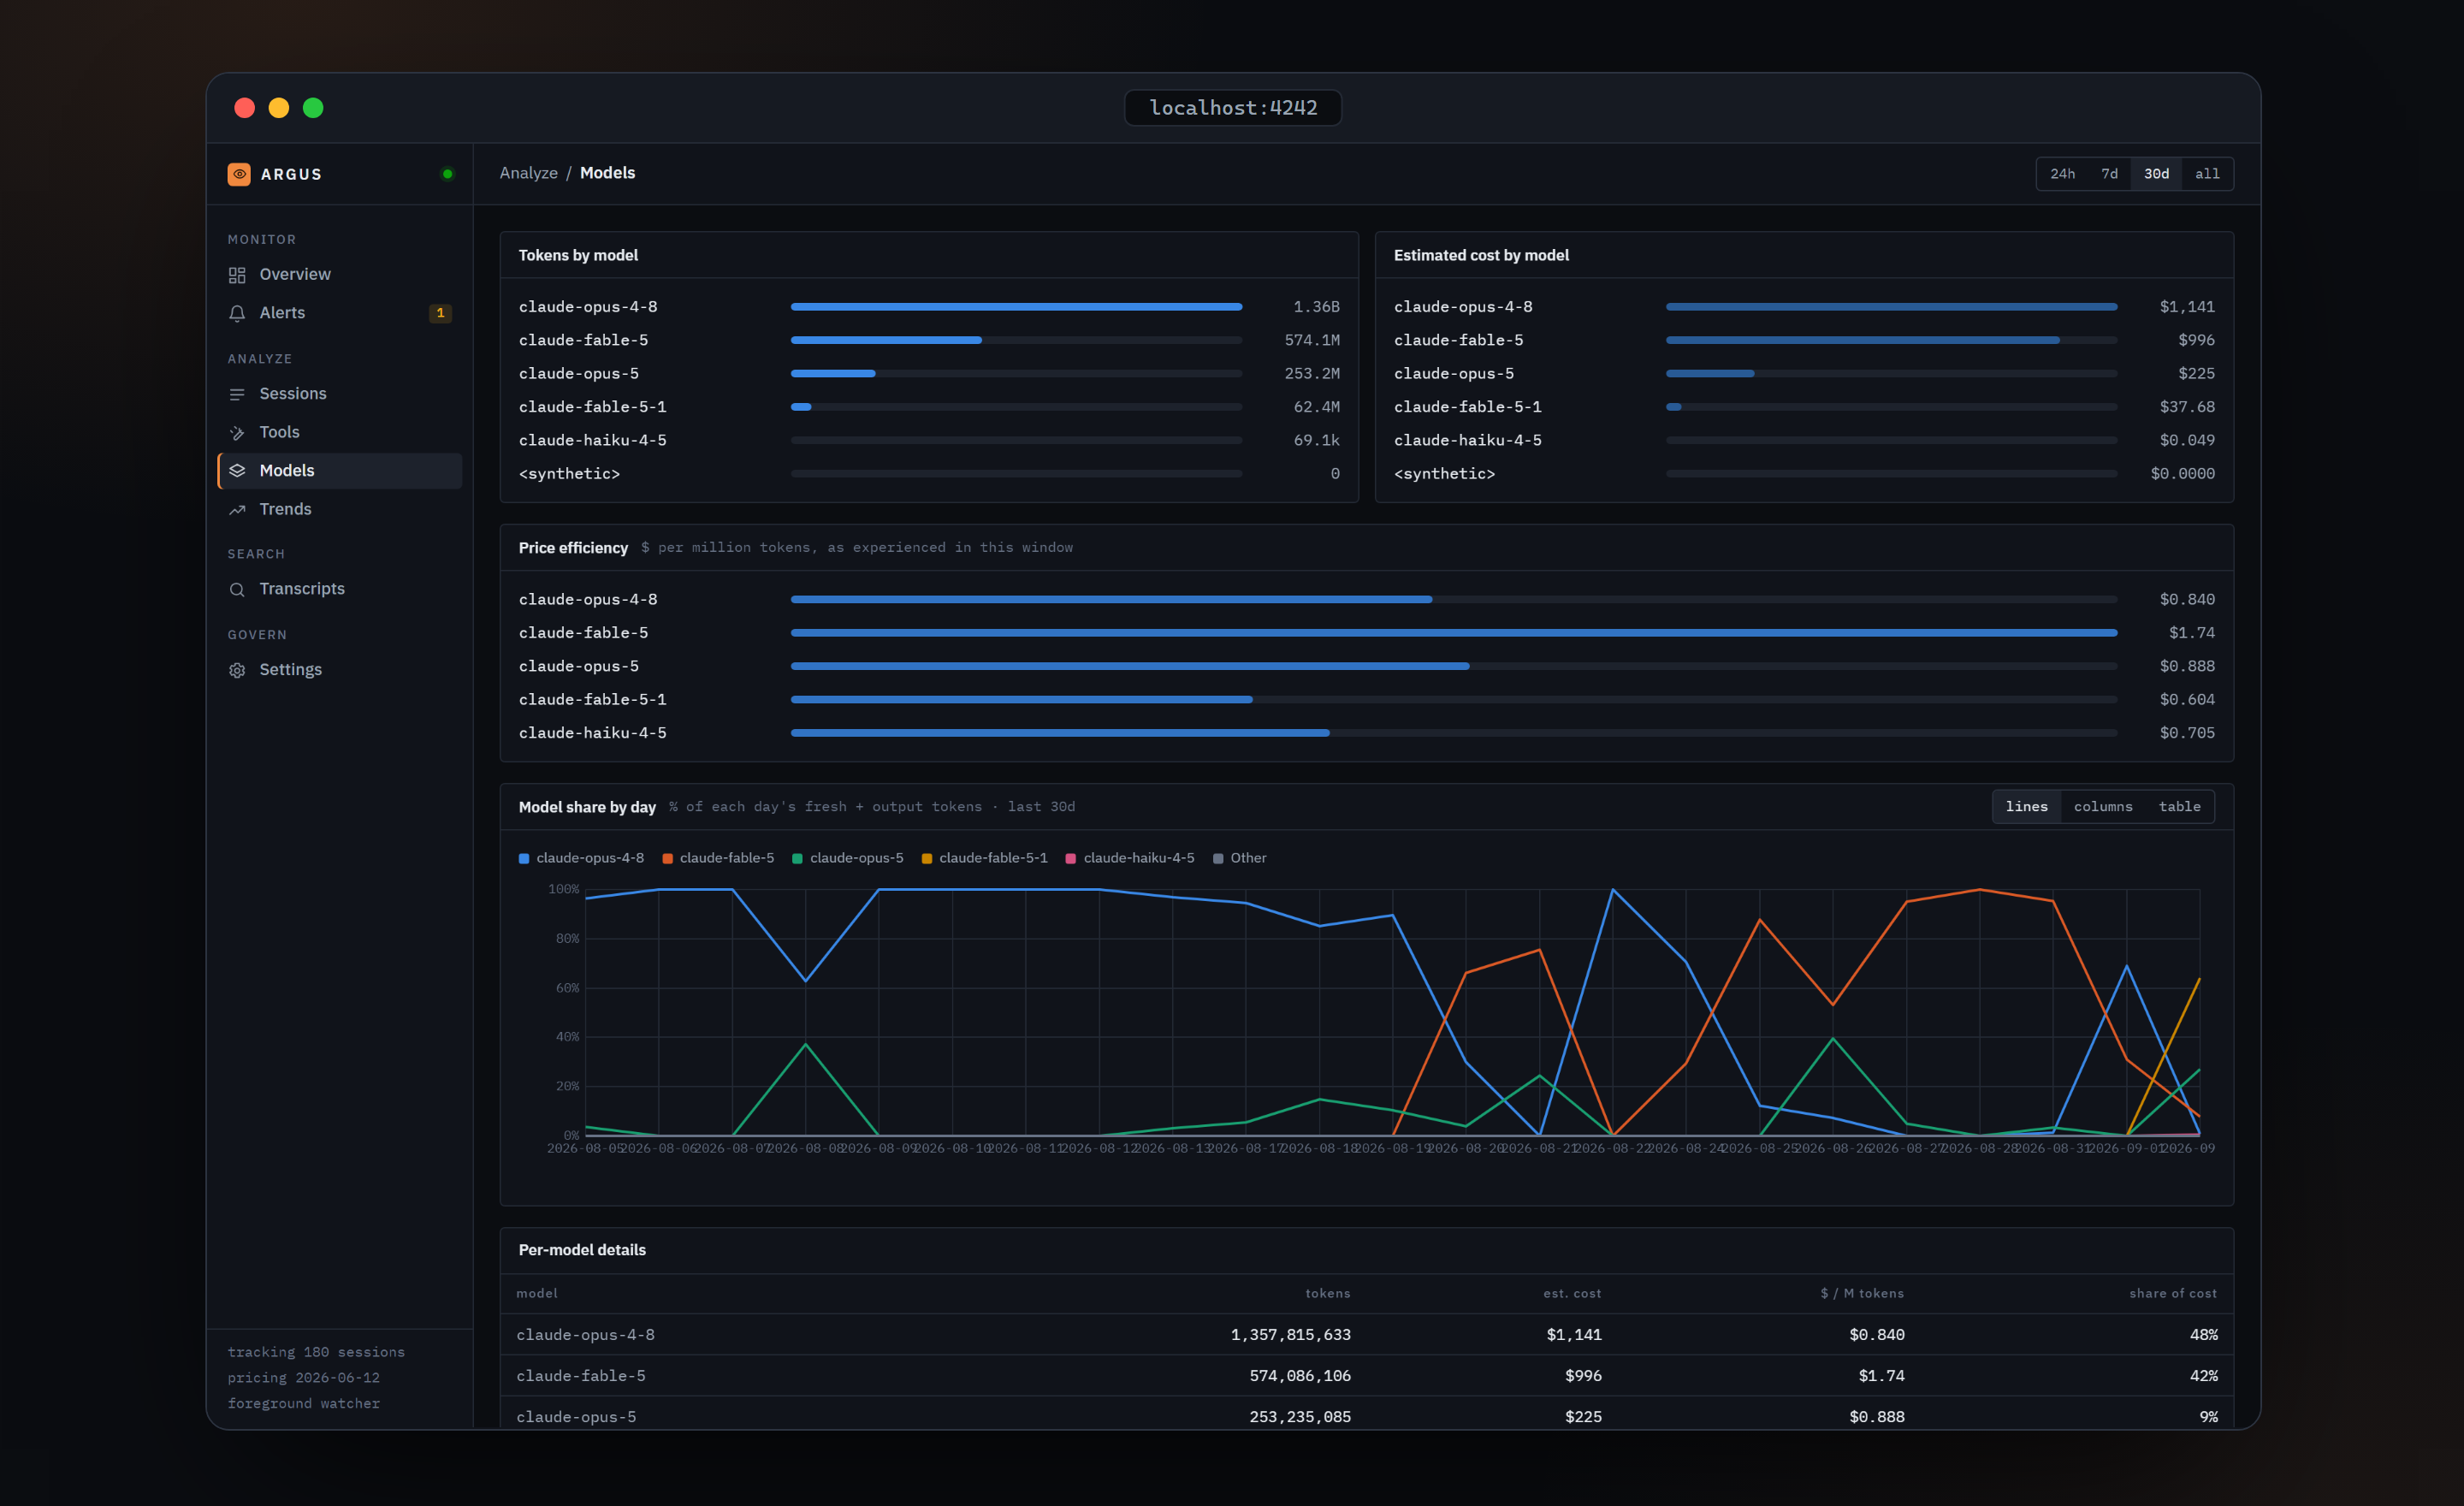
Tokens by model
Horizontal bars of all four token kinds per model, in the window. Rows are sorted by cost, not tokens, so the order matches the next panel.
Estimated cost by model
The same rows, priced. It is a separate chart rather than a second axis because tokens and dollars are different scales, and the chart rules allow one axis per chart.
Price efficiency
Dollars per million tokens, as you actually experienced it in this window:
cost ÷ (tokens ÷ 1,000,000)This is not the list price. It blends fresh input, output, cache reads and cache writes at their different rates, so a model you use with a warm cache shows a lower figure than one you use cold. Models with zero tokens in the window are dropped.
Model share by day, or by week
The title follows the window: days for 24h, 7d and 30d, the last 26 weeks for all. Each bucket shows the percentage of that period's fresh input plus output tokens per model, top five plus Other. Three views on the right:
- lines: normalised shares on a fixed 0 to 100 percent axis.
- columns: stacked columns normalised per period; the hover card still shows the raw token counts alongside the percent.
- table: whole-percent shares per period.
Per-model details
| Column | Meaning |
|---|---|
| model | Canonical model name; a date suffix like -20250929 is stripped before pricing |
| tokens | All four kinds |
| est. cost | Priced total |
| $ / M tokens | The price-efficiency figure above; — for zero tokens |
| share of cost | This model's cost ÷ the sum of all model costs in the window |
A model that is not in the price table shows real tokens and a cost of zero, which also makes its share of cost zero. See how cost is estimated.
Verified against argus-code 0.5.2.