Session detail
Session shape, the Overview and Timeline tabs, and resumed-session stitching.
Open a session by clicking a row on Sessions or Overview, picking it in Ctrl+K, following an "Open session" link from search, or with a direct link to /sessions/<id>. The tab is in the query string: ?tab=overview, ?tab=timeline or ?tab=subagents.
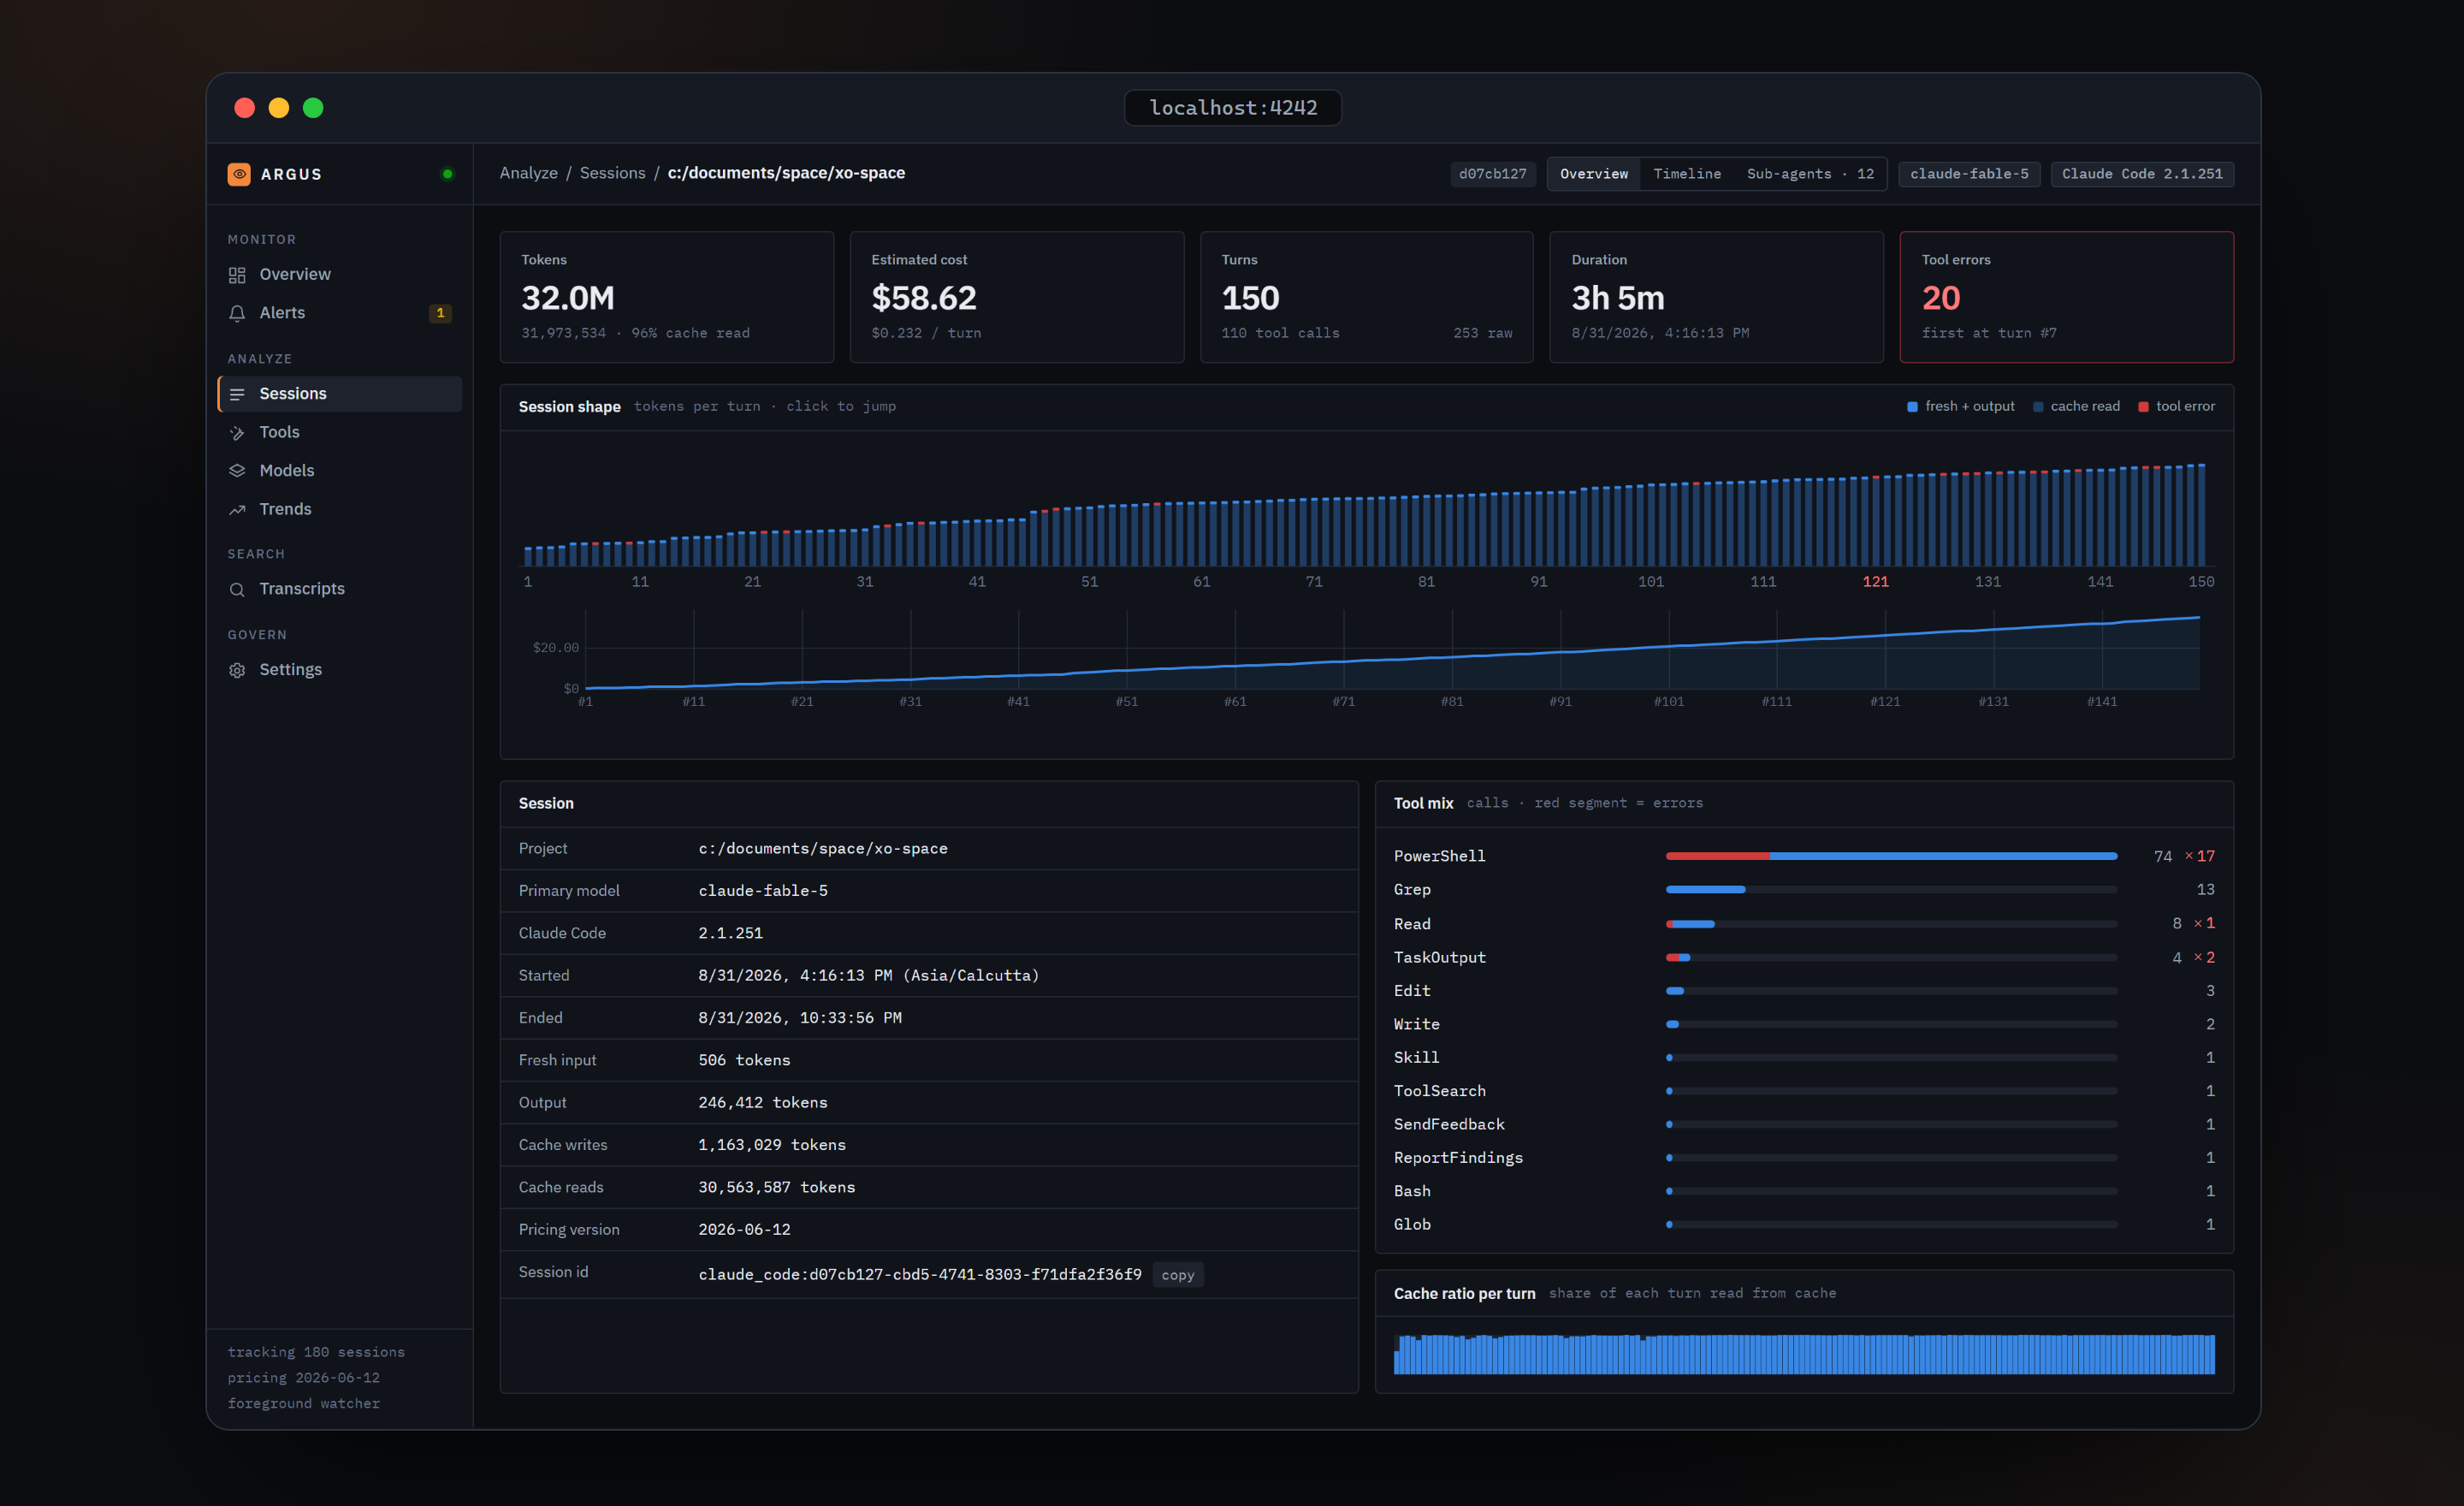
Top bar
Breadcrumbs show the project. Next to them is a chip with the first eight characters of the session id; click it to copy the full id, which is what claude --resume <id> takes. Then the three tabs, the primary model, and the Claude Code version that wrote the transcript.
Five tiles
| Tile | Value |
|---|---|
| Tokens | All four kinds. Below: the exact count and the cache-read share |
| Estimated cost | Total, and cost per turn below |
| Turns | Number of turns, with the total tool calls below. A 253 raw note appears when the raw transcript count differs, see stitching below |
| Duration | Start to last turn, or the word live if the session is still running. Local start time below |
| Tool errors | Number of turns that contained at least one failing tool call. The whole tile turns red when non-zero, with first at turn #7 below |
Session shape
One column per turn, in time order. The dark base of a column is all tokens for that turn; the brighter cap is fresh input plus output. The cap turns red on a turn with a failing tool call. Every fifth turn is labelled, every tenth past 60 turns, and an error turn gets a red label. Hover for #42 · 1.2k fresh+output · 61.6k cache read.
Click a column to jump: it selects the turn, switches to the Timeline tab if needed, and scrolls that row into view, outlined in orange.
Below the columns is the cumulative estimated cost across turns, so a steep segment shows where the money went.
Resumed sessions are stitched
Claude Code restarts its turn counter at zero every time a session is resumed, so a raw transcript can contain several turns numbered 0. Argus sorts all turns by timestamp and renumbers them 1 to n. Every #N on this page is that chronological number, not the raw one. On the server, each tool call is attached to exactly one turn, which fixed a case where a session resumed fifteen times appeared to have 78,000 tool calls instead of 351.
Overview tab
Session lists project, primary model, Claude Code version, start and end in local time with the time zone, the four token totals, the pricing table version used, and the session id with a copy button.
Tool mix has one bar per tool, most-called first. A red overlay on a bar is the error count on the same scale, followed by ✕ 3.
Cache ratio per turn shows one thin bar per turn, filled from the bottom by the share of that turn's tokens that came from cache. A drop means Claude paid full price for its context on that turn.
Timeline tab
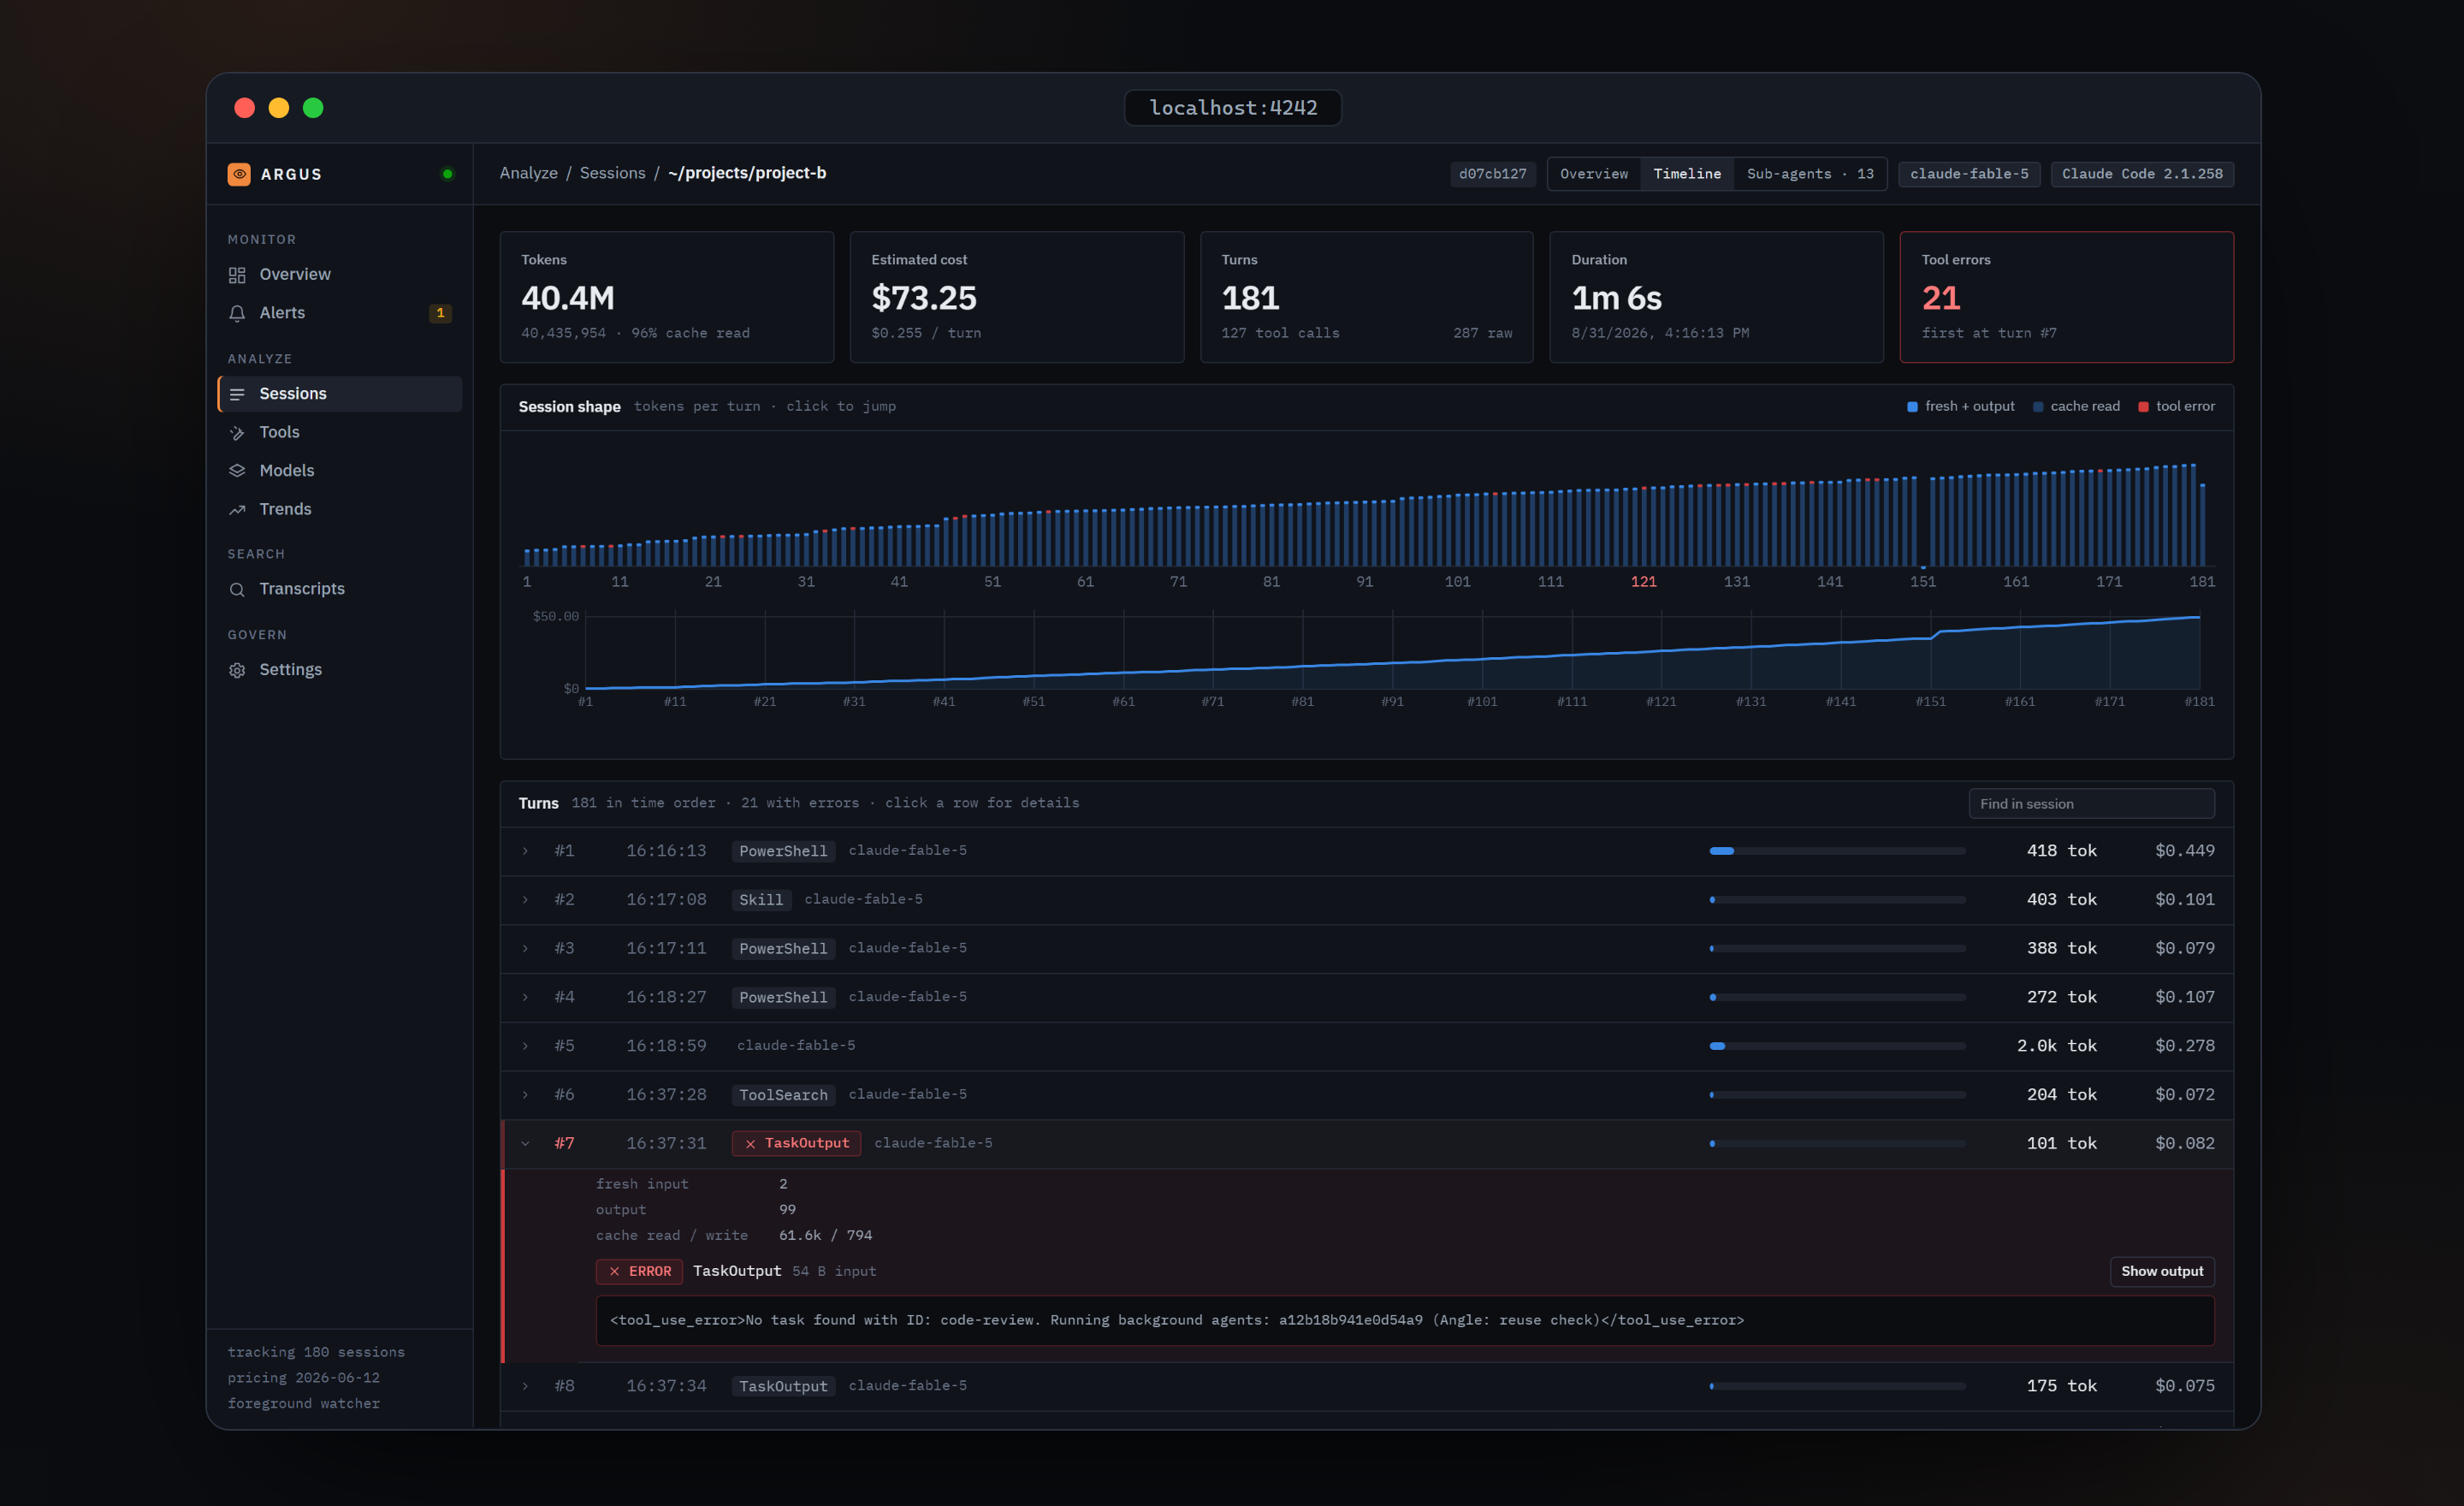
The header reads 150 in time order · 20 with errors · click a row for details. On the right, Find in session searches this session's transcript once you type two characters and reports 12 matches with up to five previews. It reports matches but does not filter the rows. With indexing off it says so and points you to Settings.
Each row, left to right: a chevron, #N, the time, an Agent pill when a call spawned a sub-agent, up to four tool chips with a +3 overflow, the model, a cost bar relative to the most expensive turn, 418 tok of fresh input plus output, and the cost. A failing call renders as a red pill instead of a grey chip. A turn with any error gets a faint red wash, a red rail on the left, and a red #N. MCP tools show as server · tool; hover for the full mcp__server__tool name.
Click a row, or press Enter, to expand it: a small grid of fresh input, output and cache read/write, then one block per tool call with an OK or ERROR pill, the full tool name, the input size, a sub-agent pill when present, and Show output. Failing calls print their error text inline in a red-bordered box.
Show output fetches the stored result on demand. It shows the text, or No stored output for Bash. if nothing was kept, or Enable transcript indexing in Settings to keep tool output. when indexing is off. Inline error text also depends on indexing.
Long sessions render 150 turns at a time behind a Show 150 more turns · 300 remaining button.
Sub-agents tab
Everything a session delegated has its own page: Sub-agents.
Verified against argus-code 0.5.2.