The dashboard
The sidebar, status dot, Ctrl+K palette, colour rules, and how cost is estimated.
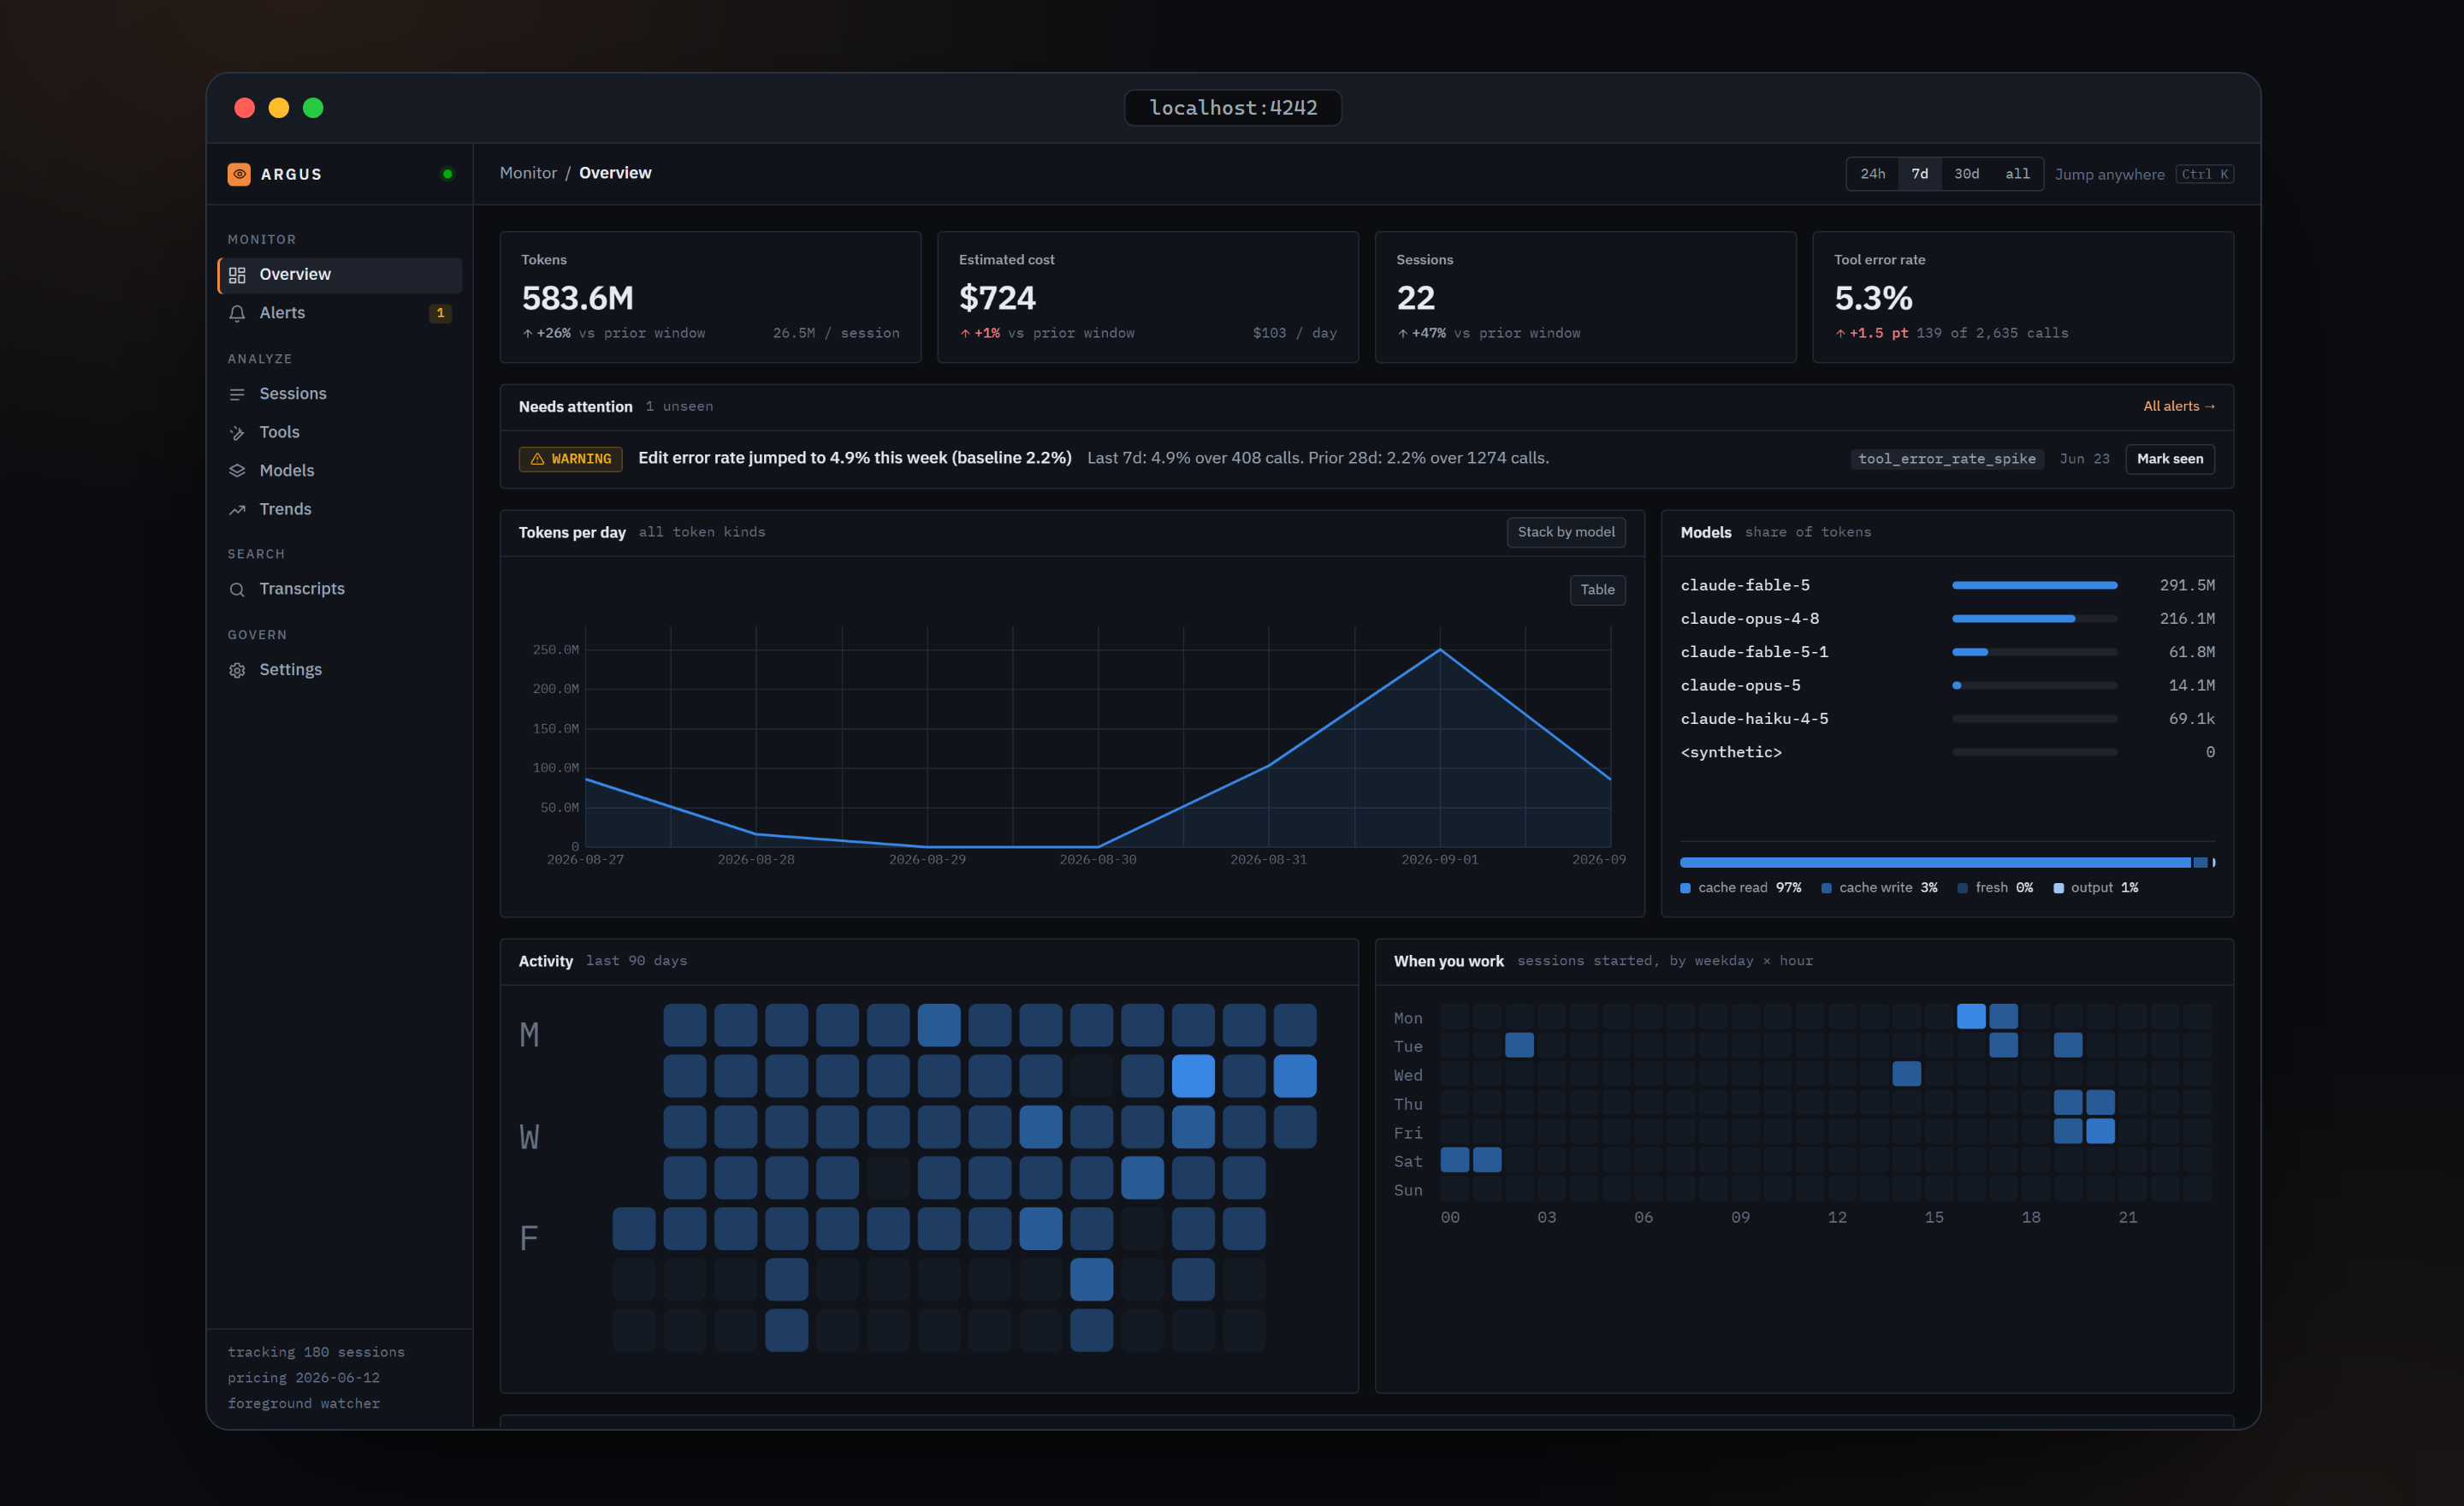
Every screen shares the same shell: a sidebar on the left, a breadcrumb bar on top, and a few conventions for colour and charts that hold everywhere. Learn them once and every page reads the same way.
The sidebar
Four groups, fixed items:
| Group | Pages |
|---|---|
| MONITOR | Overview /, Alerts /alerts |
| ANALYZE | Sessions /sessions, Tools /tools, Models /models, Trends /trends |
| SEARCH | Transcripts /search |
| GOVERN | Settings /settings |
The active page has a grey background and a 2px orange rail on its left. The Alerts row shows an amber badge with the number of unseen alerts; that count refreshes every 10 seconds.
Next to the ARGUS wordmark is a status dot: green when idle, amber and pulsing while transcripts are being ingested.
The footer has three monospace lines: ingesting 412/1183 or tracking 180 sessions; pricing 2026-06-12, the price table in use; and foreground watcher or argusd daemon, which tells you whether this process or the background daemon is doing the ingestion.
Jump anywhere with Ctrl+K
Ctrl+K (Cmd+K on macOS) opens a command palette. Escape or a click outside closes it. It lists every page and the first 200 sessions, each shown as a short date, a shortened project path and the primary model. Typing matches against project path, model and session id.
Pages are code-split and preload when you hover a link, so most navigation is instant. Data is cached for 30 seconds and does not refetch when you switch back to the tab.
Colour vocabulary
| Colour | Meaning |
|---|---|
| Orange | Interface only: the active nav item, an active filter chip, the focus ring, a selected turn, a search highlight. Orange is never data |
| Blue | The single-series data colour. One series on a chart is always blue |
| Six-slot palette | Multi-series charts use a fixed order: blue, orange-red, green, gold, pink, grey. Grey is always the "Other" bucket, and charts fold everything past the fifth series into it |
| Blue ramp | Heatmaps use five steps of one blue; the darkest step means nothing happened |
| Green, amber, red | Good, warning, critical. A status colour always comes with an icon and a text label, so colour is never the only signal. Error counts in tables carry an ✕ glyph |
Two more rules hold on every chart: one y-axis per chart, so two measures of different scale become two charts, and a legend appears whenever there are two or more series.
A table behind every chart
Charts have a small Table chip above them. Toggling it swaps the chart for a scrollable table of the same numbers. Some panels offer a segmented control with a table option instead. Either way, every number on a chart can be read as a number.
How cost is estimated
Every dollar figure in Argus is labelled Estimated cost or est. cost, never plain cost. Tokens are exact; costs are estimates from a price table.
Cost is computed once per turn at ingest time and stored on the turn. A session's cost is the sum of its turns, plus the totals of any sub-agents it spawned. Nothing in the dashboard recomputes cost. The formula, with all rates in dollars per million tokens:
cost = fresh_input × input_rate
     + output      × output_rate
     + cache_read  × cache_read_rate
     + cache_write × cache_write_rate
Cache writes use two rates when the transcript records both the 5-minute and 1-hour tiers; otherwise the combined count is priced at the 5-minute rate. Cache reads have their own, much cheaper rate, which is why the dashboard shows cache-read share so often.
The price table is a JSON file bundled with each release; the newest file by date wins. argus pricing refresh fetches LiteLLM's public table and writes a new dated file. Each session records the table version it was priced with, shown on the session's Overview tab as Pricing version.
Unknown models cost zero
A model missing from the price table is priced at zero for every turn. The tokens are still exact; only the dollar figure is missing, and the dashboard shows no badge for it. When a later table knows the model, those sessions are re-priced on the next start.
Verified against argus-code 0.5.2.